Lesson graph - sample
…
-----
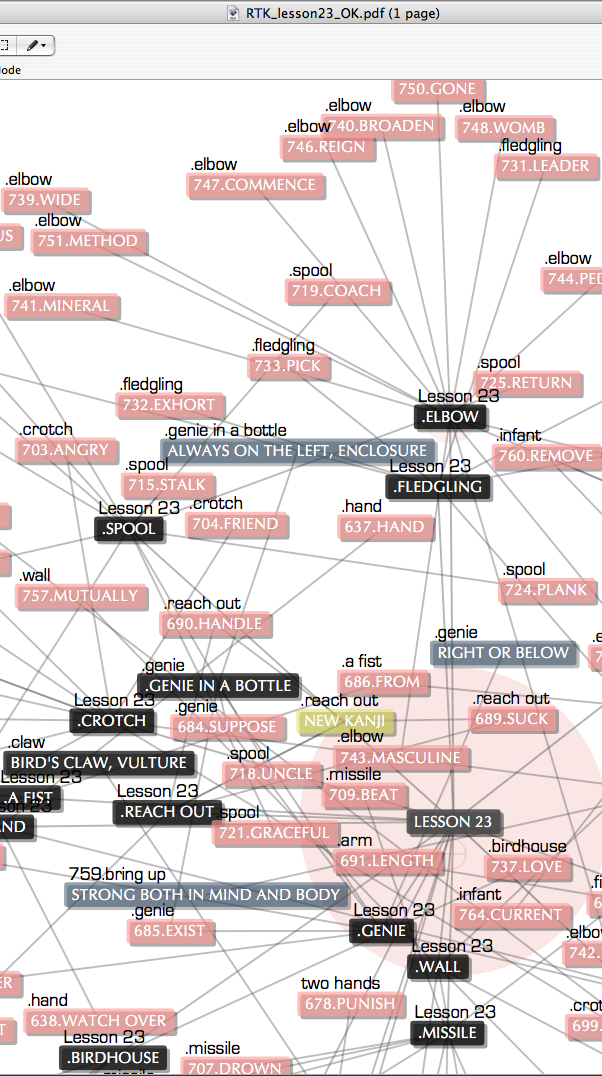
On thursday, I put some time into modifying the nodebox graph script for visualizing all the Kanji in a single lesson (23) of the Heisig book. White background is ideal for printing.
A new feature is the small black type that displays the origin of all individual nodes. Very useful for knowing, which primitive is the root for the individual characters.
Here's a zoomed in screenshot sample from the output PDF.
I will build 2 detailed examples of lesson graphs, and put them in as a central image of my final poster. The poster will be information graphics aimed for students of the language (according to the new poster brief I wrote yesterday), so I have a challenge in making it visually appealing with all the information and detail in there.
Maybe forming a figure, or a recognizable shape out of the individual lesson graphs ... or illustrating/retouching the graph by including ready-made illustrations in the graph algorithm or slicing them in later by hand in Illustrator.
I had an other idea (better, I think) about an inspirational poster, communicating both the Heisig method and the complexity and beauty of the Kanji graphs in a more concrete image, bordering on poster art. It would have Chinese mountains in it. But that wouldn't complete the brief I just wrote (dang, what a limitation ..), so I have to leave it out, or rewrite the brief again.
Btw, rewriting the brief is an essential part of the design process, according to the Design Methods book. Because research, and the creative transformation stage almost always redefine the original goals :: revealing what should really be done to reach the goals, as opposed to what you were told to do in the brief to reach the goals. Doesn't that make sense? I think it does.
The brief should be frozen before moving on to production, of course. But that shouldn't happen too soon in the process.