Politicians Sankey - Day 1: Sketches
The first idea was to visualize the geographic distribution (on a map of Italy divided by region) of politicians quantity, with a focus on their gender, age and education level. We discard this solution because it appear to be too crowded.
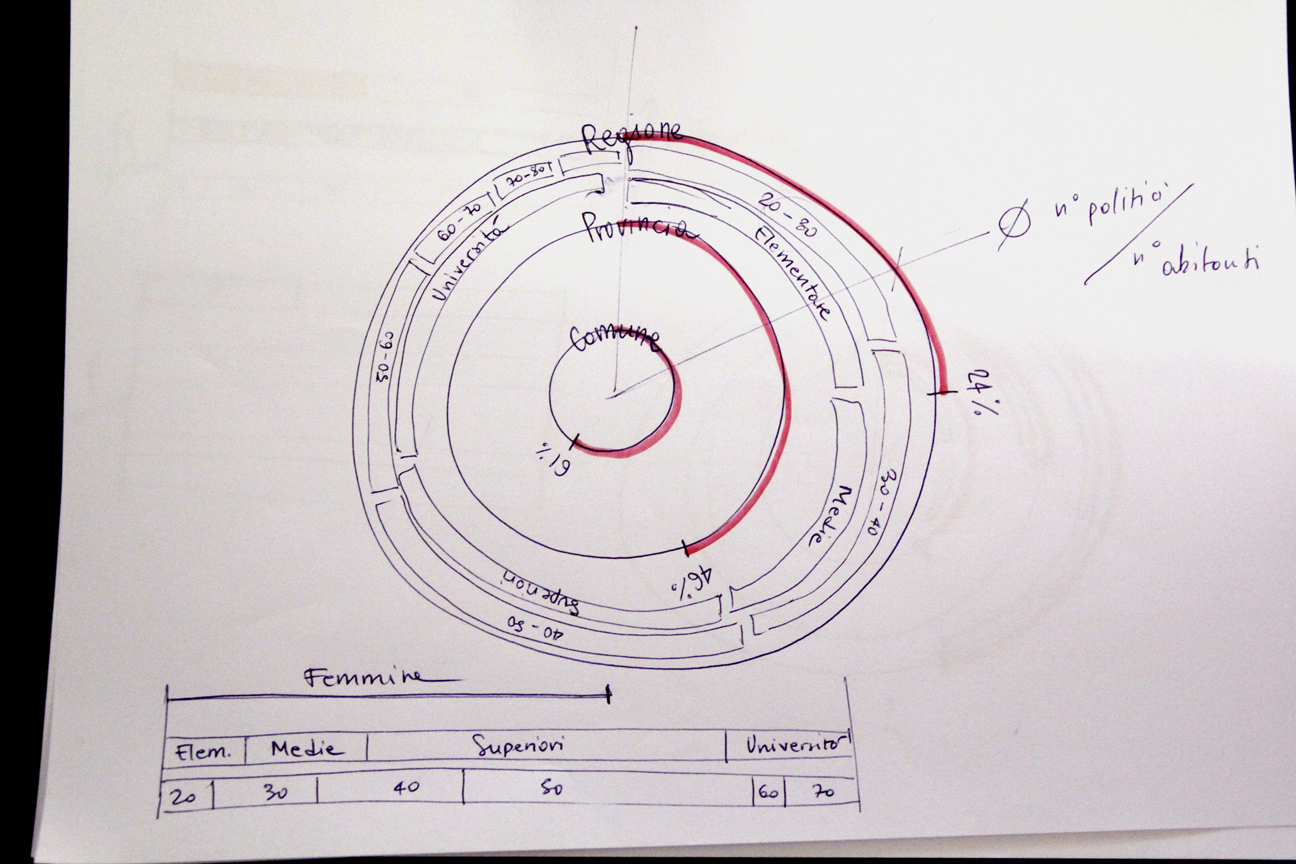
Our final idea is to compare the Italian politicians between women and men in administrative levels (region, district, city) at different education level and age distribution.<div>To visualize these data we will use a tree structure. The width of each branch is related to the number of politicians.
</div>