Politicians Sankey - Final Poster
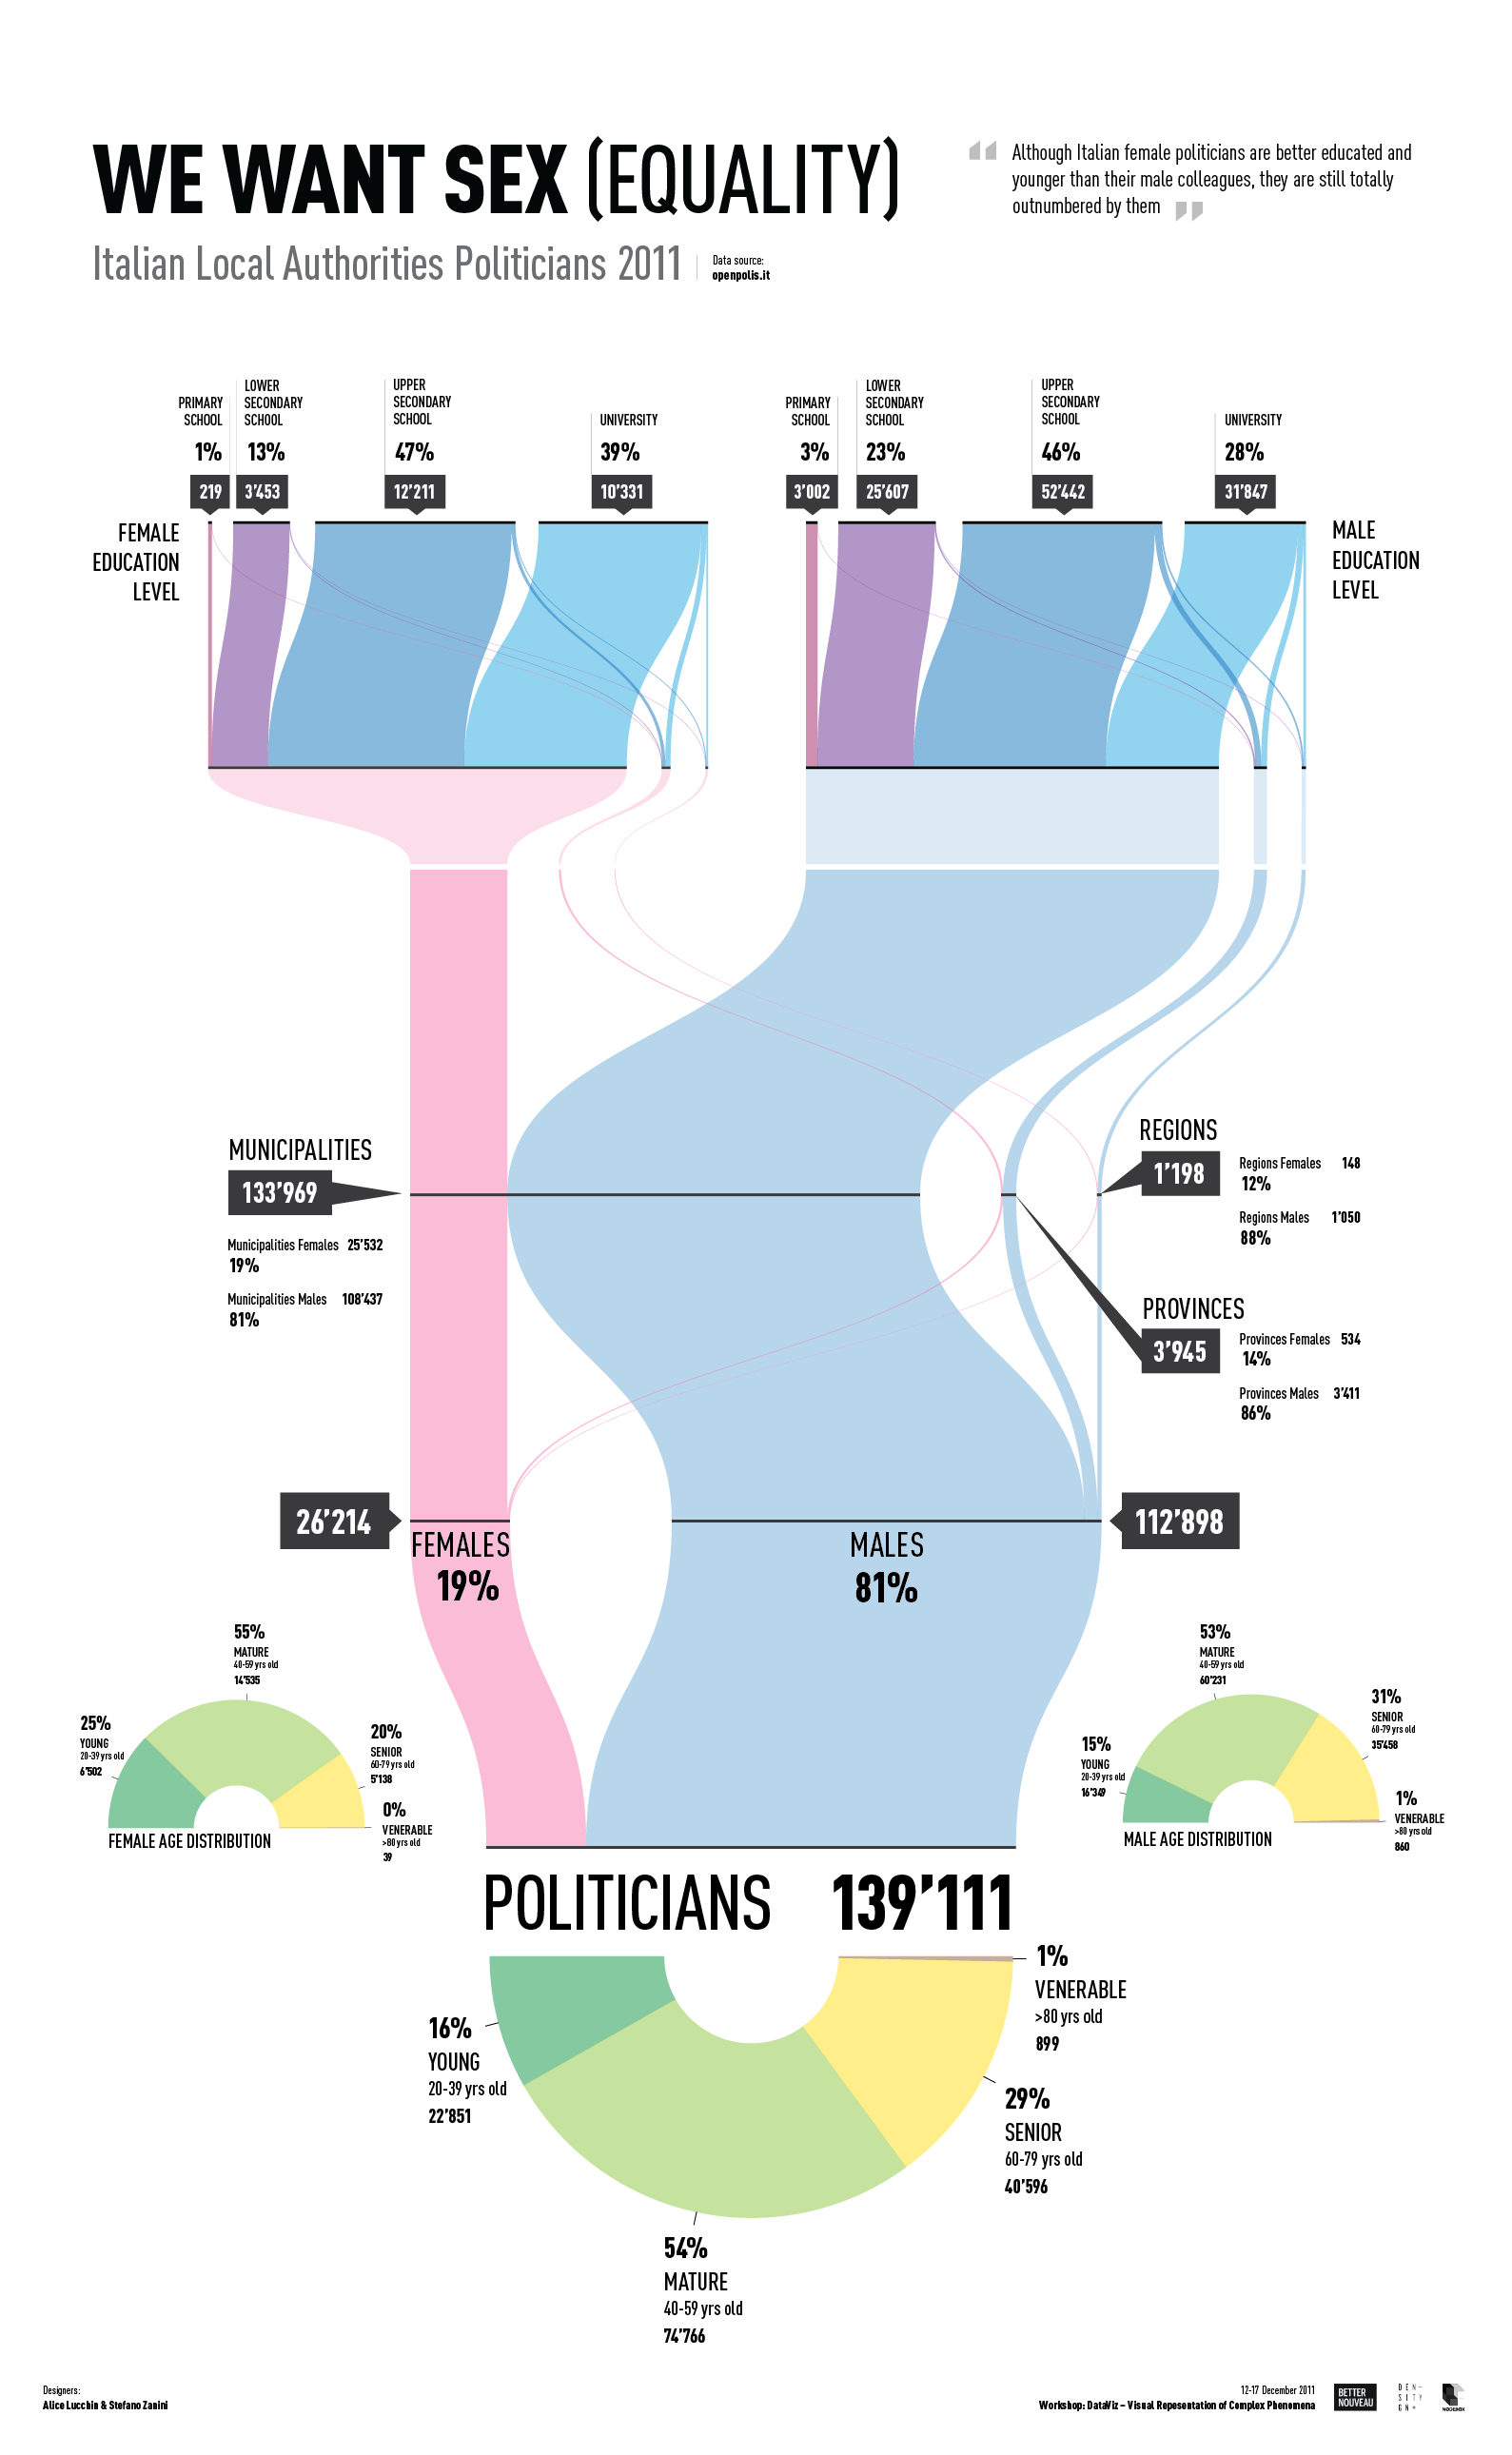
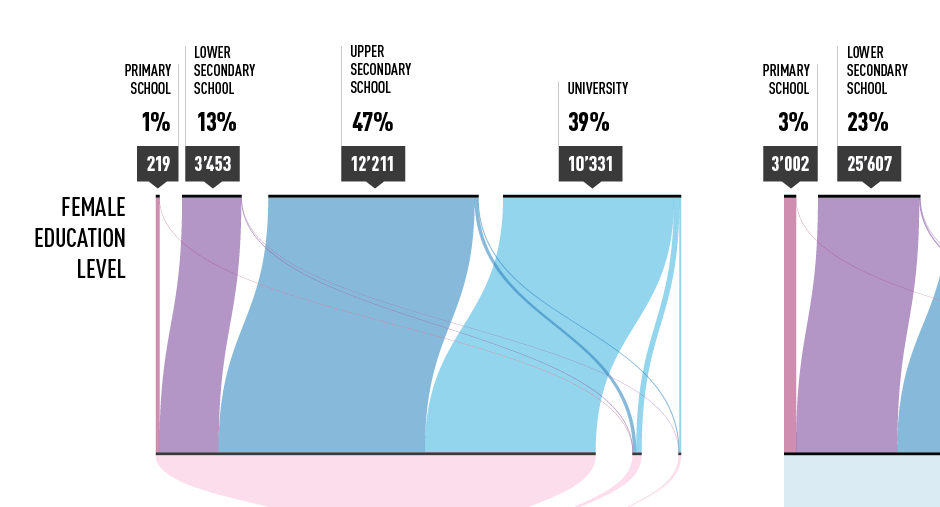
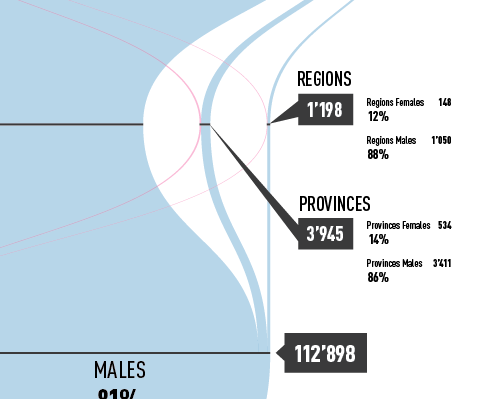
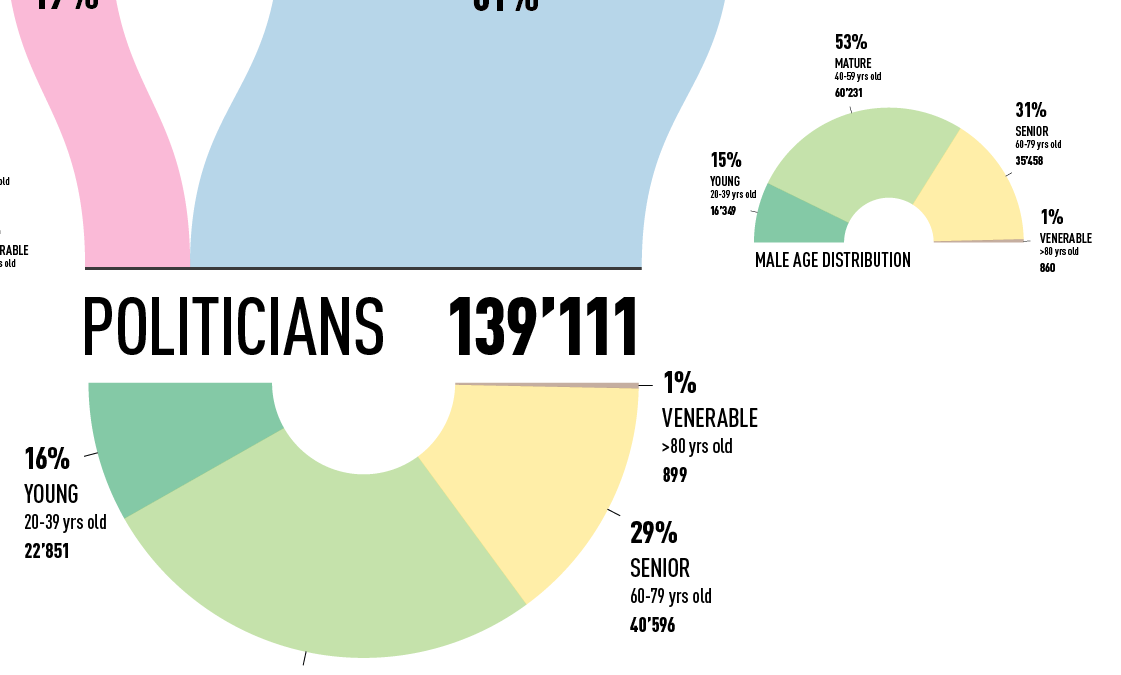
Our visualization is focused on the difference in gender and their numbers, distribution and composition of the Italian local authorities politicians. The visualization begins from the bottom representing the age distribution by using some half-donut charts. It clearly shows that the average age of the Italian politicians is quite high, with only 16% lower than 39 years old. The females are slightly younger with 25% of them below 39 years of age. <div>Going from the bottom to the top, the chart shows the volumes distribution of the politicians by using a Sankey chart. It is easy to see how females are generally outnumbered by males with an average ratio of 1 to 4 in every branch of the local authorities.</div><div>At the top of the chart it is possible to appreciate the difference between genders in education level. The visualization is normalized as to show the percentages of the different education levels among genders. The female education level is higher than males.</div><div>we can conclude therefore that although Italian female politicians are better educated and younger than their male colleagues, they are still totally outnumbered by them. </div>