#OWS Rollecoaster
After two days of hard work of our group with the aid of Tom, Frederick and Damiano we finally have a first sketch in node box.<div>
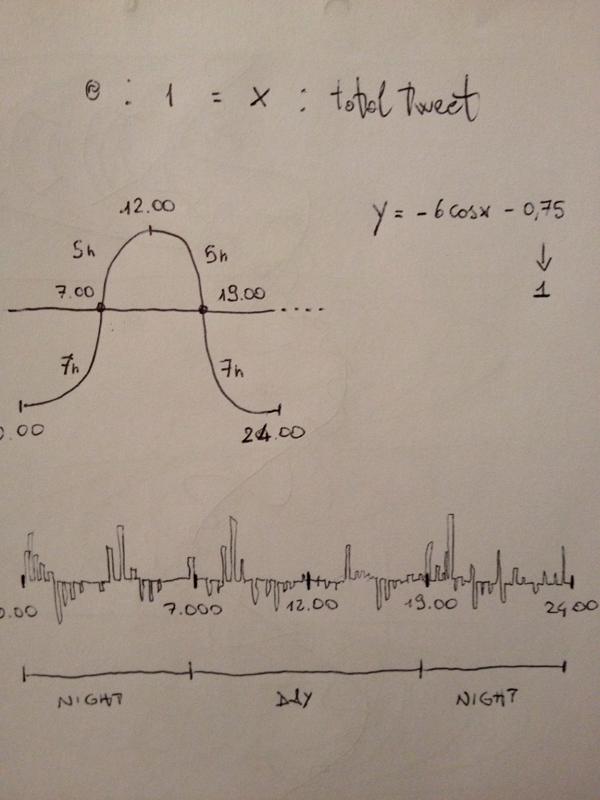
</div><div>The tweets of the last 5 days of “Occupy Wall Street” will be then displayed on a timeline, following their timestamp normalized value dived in sinus shape for each day parted in daytime and night time., along with the display of the three keywords characteristic of each time of the day.</div><div><div>
</div><div>Our relevant data are: the tweet’s timestamp, the calculated keyword of the tweet, the weight of that keyword, the polarity of the tweet (positive, negative), the number of retweets.</div><div>
</div><div>Detailed history of the process follows.</div><div>
</div><div>1. Tom made a reduced collection of ~33.000 tweets with some additional data provided by some Pattern analysis which includes the fields you can see in the picture below.</div><div>
</div><div>2. Matteo provided a final draft of how our data visualization should theoretically appear as see in picture below</div></div><div>
</div><div>3. I cleaned up the data file, reduced the column of the data file and converted the date and time fields into NYC timestamp with some php.</div><div>
</div><div>4. We finally made-up a plan to start sketching our project in nodeBox along with Damiano</div><div>
</div><div>5. Finally we have our first sketch in nodeBox:</div><div>
</div><div>And now… further problems to solve … </div><div>
</div><div>
</div><div>
</div>