#OWS Rollecoaster
The task is to create a poster that visualize, trough the Twitter data feed from 12 to 17 November 2011, the mood of the conversation about 'Occupy Wall Street' movement.
We intend to process nearly 350.000 Twits, and evaluate (using the powerful Pattern library) the 'sentiment' that each text is aimed to represent, the most relevant keyword and its incidence value, the most mentioned characters/twitter account in the discussion. We also have the timestamp for each Twit so that we can span the resulting data alongside the timeline of the events.
Graphically speaking we intend to create a poster including the five days timeline vertically displayed, each day get divided in day/night sections (in order to possibly read the data while pointing out the differences in between day and night).
Alongside the line that divides the single days we'll visualize the mood of the conversation.
As a bouns we'd like to point out a chart for the most popular trands / hashtags, as well as for the most mentioned accounts.
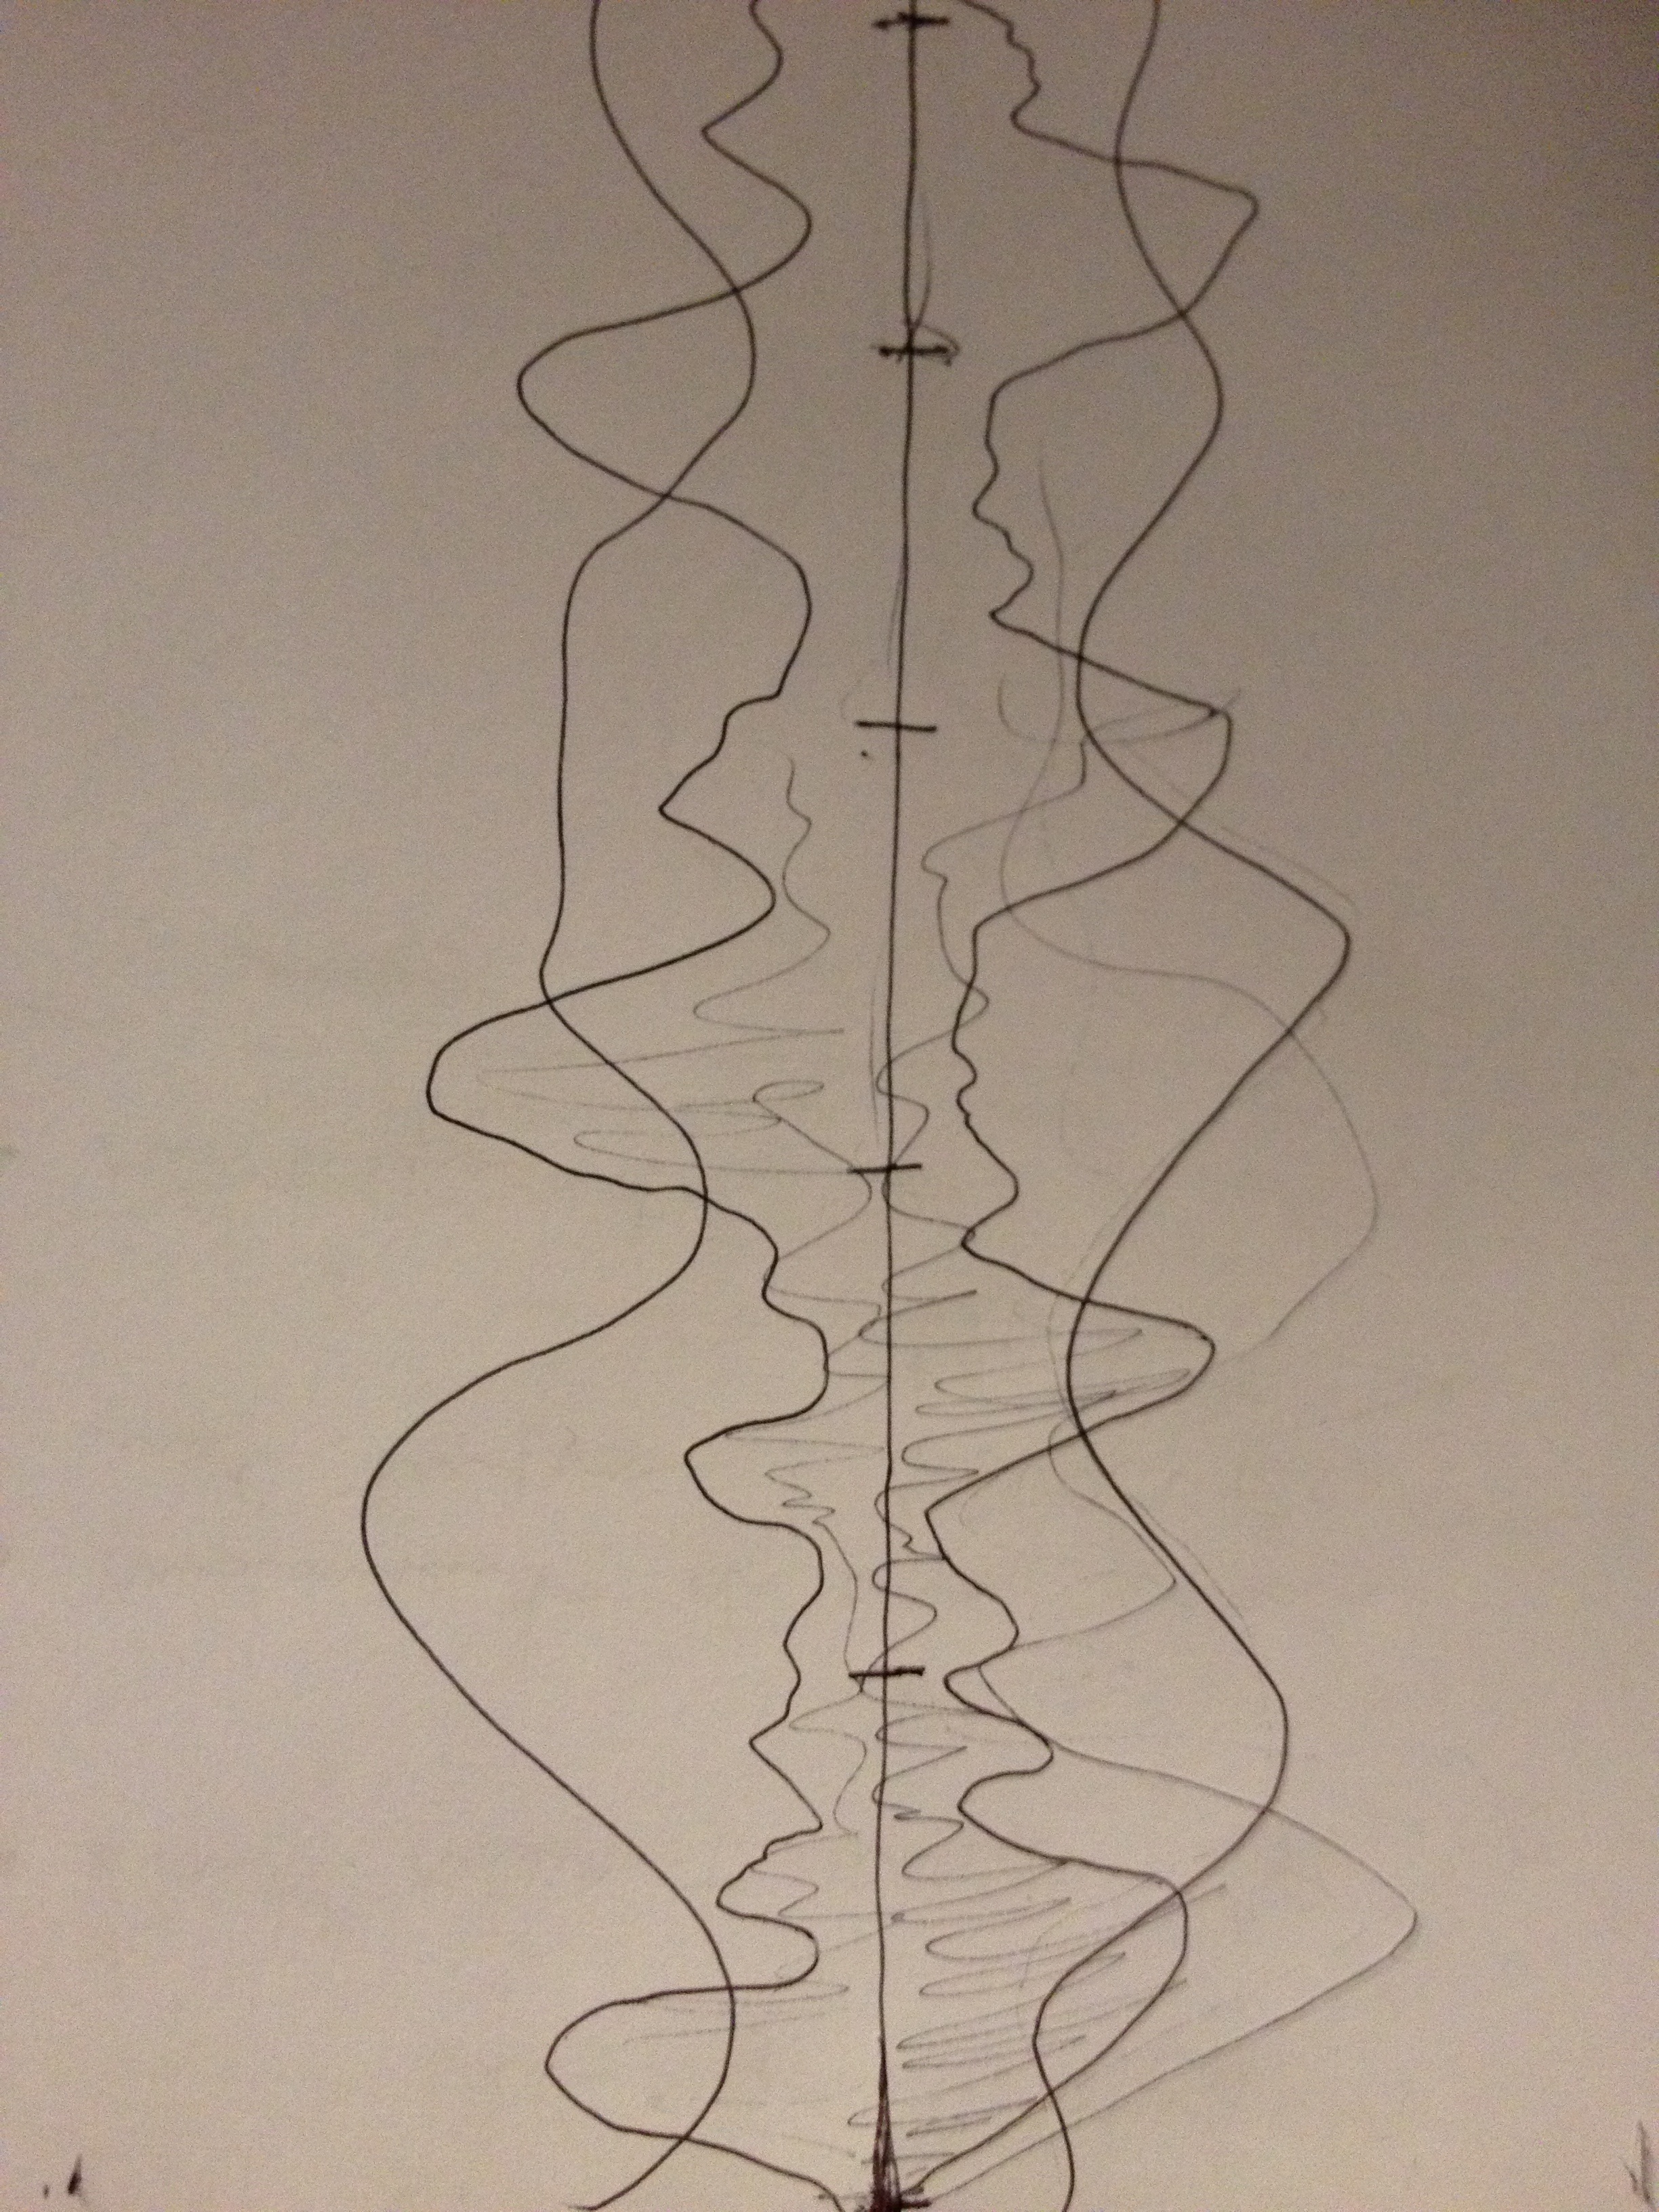
Attached are few preliminary sketches.
Cheers!
Alberto
Matteo
Riccardo