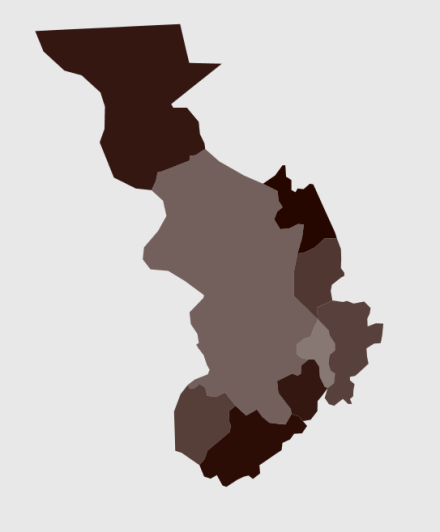
Visualizing Antwerp: available facilities vs population composition
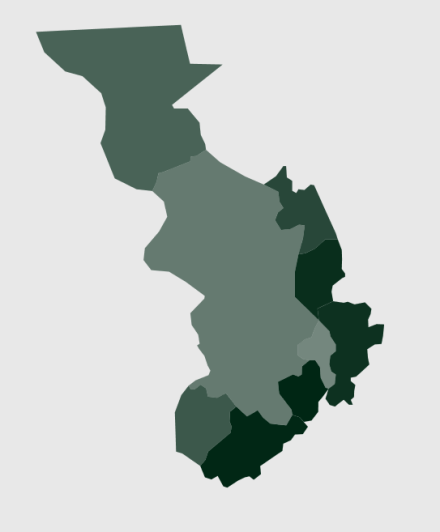
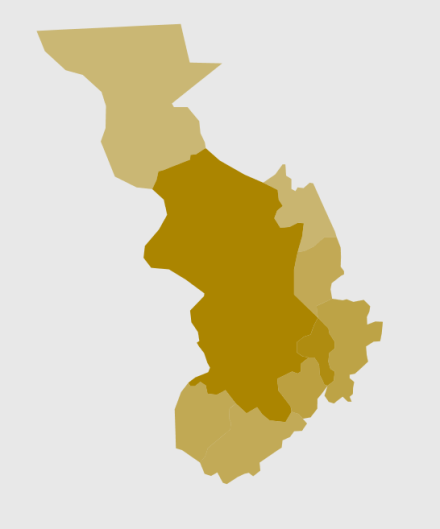
HONDWERPEN tries to map the correlation between the composition of the population in the different districts of Antwerp (average age, income, relation Belgians-foreigners, …) and the available facilities (police stations, playgrounds, cultural centres and sports facilities, …).
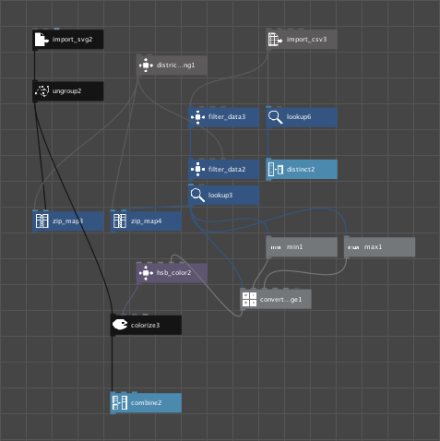
Right now we have managed to create a system to display the average compositions per district on a vector-map of Antwerp.
The next step is to be able to display the facilities on their exact location the map (based on their coordinates), and then to create a system of displaying the facilities per 1000(?) persons.
