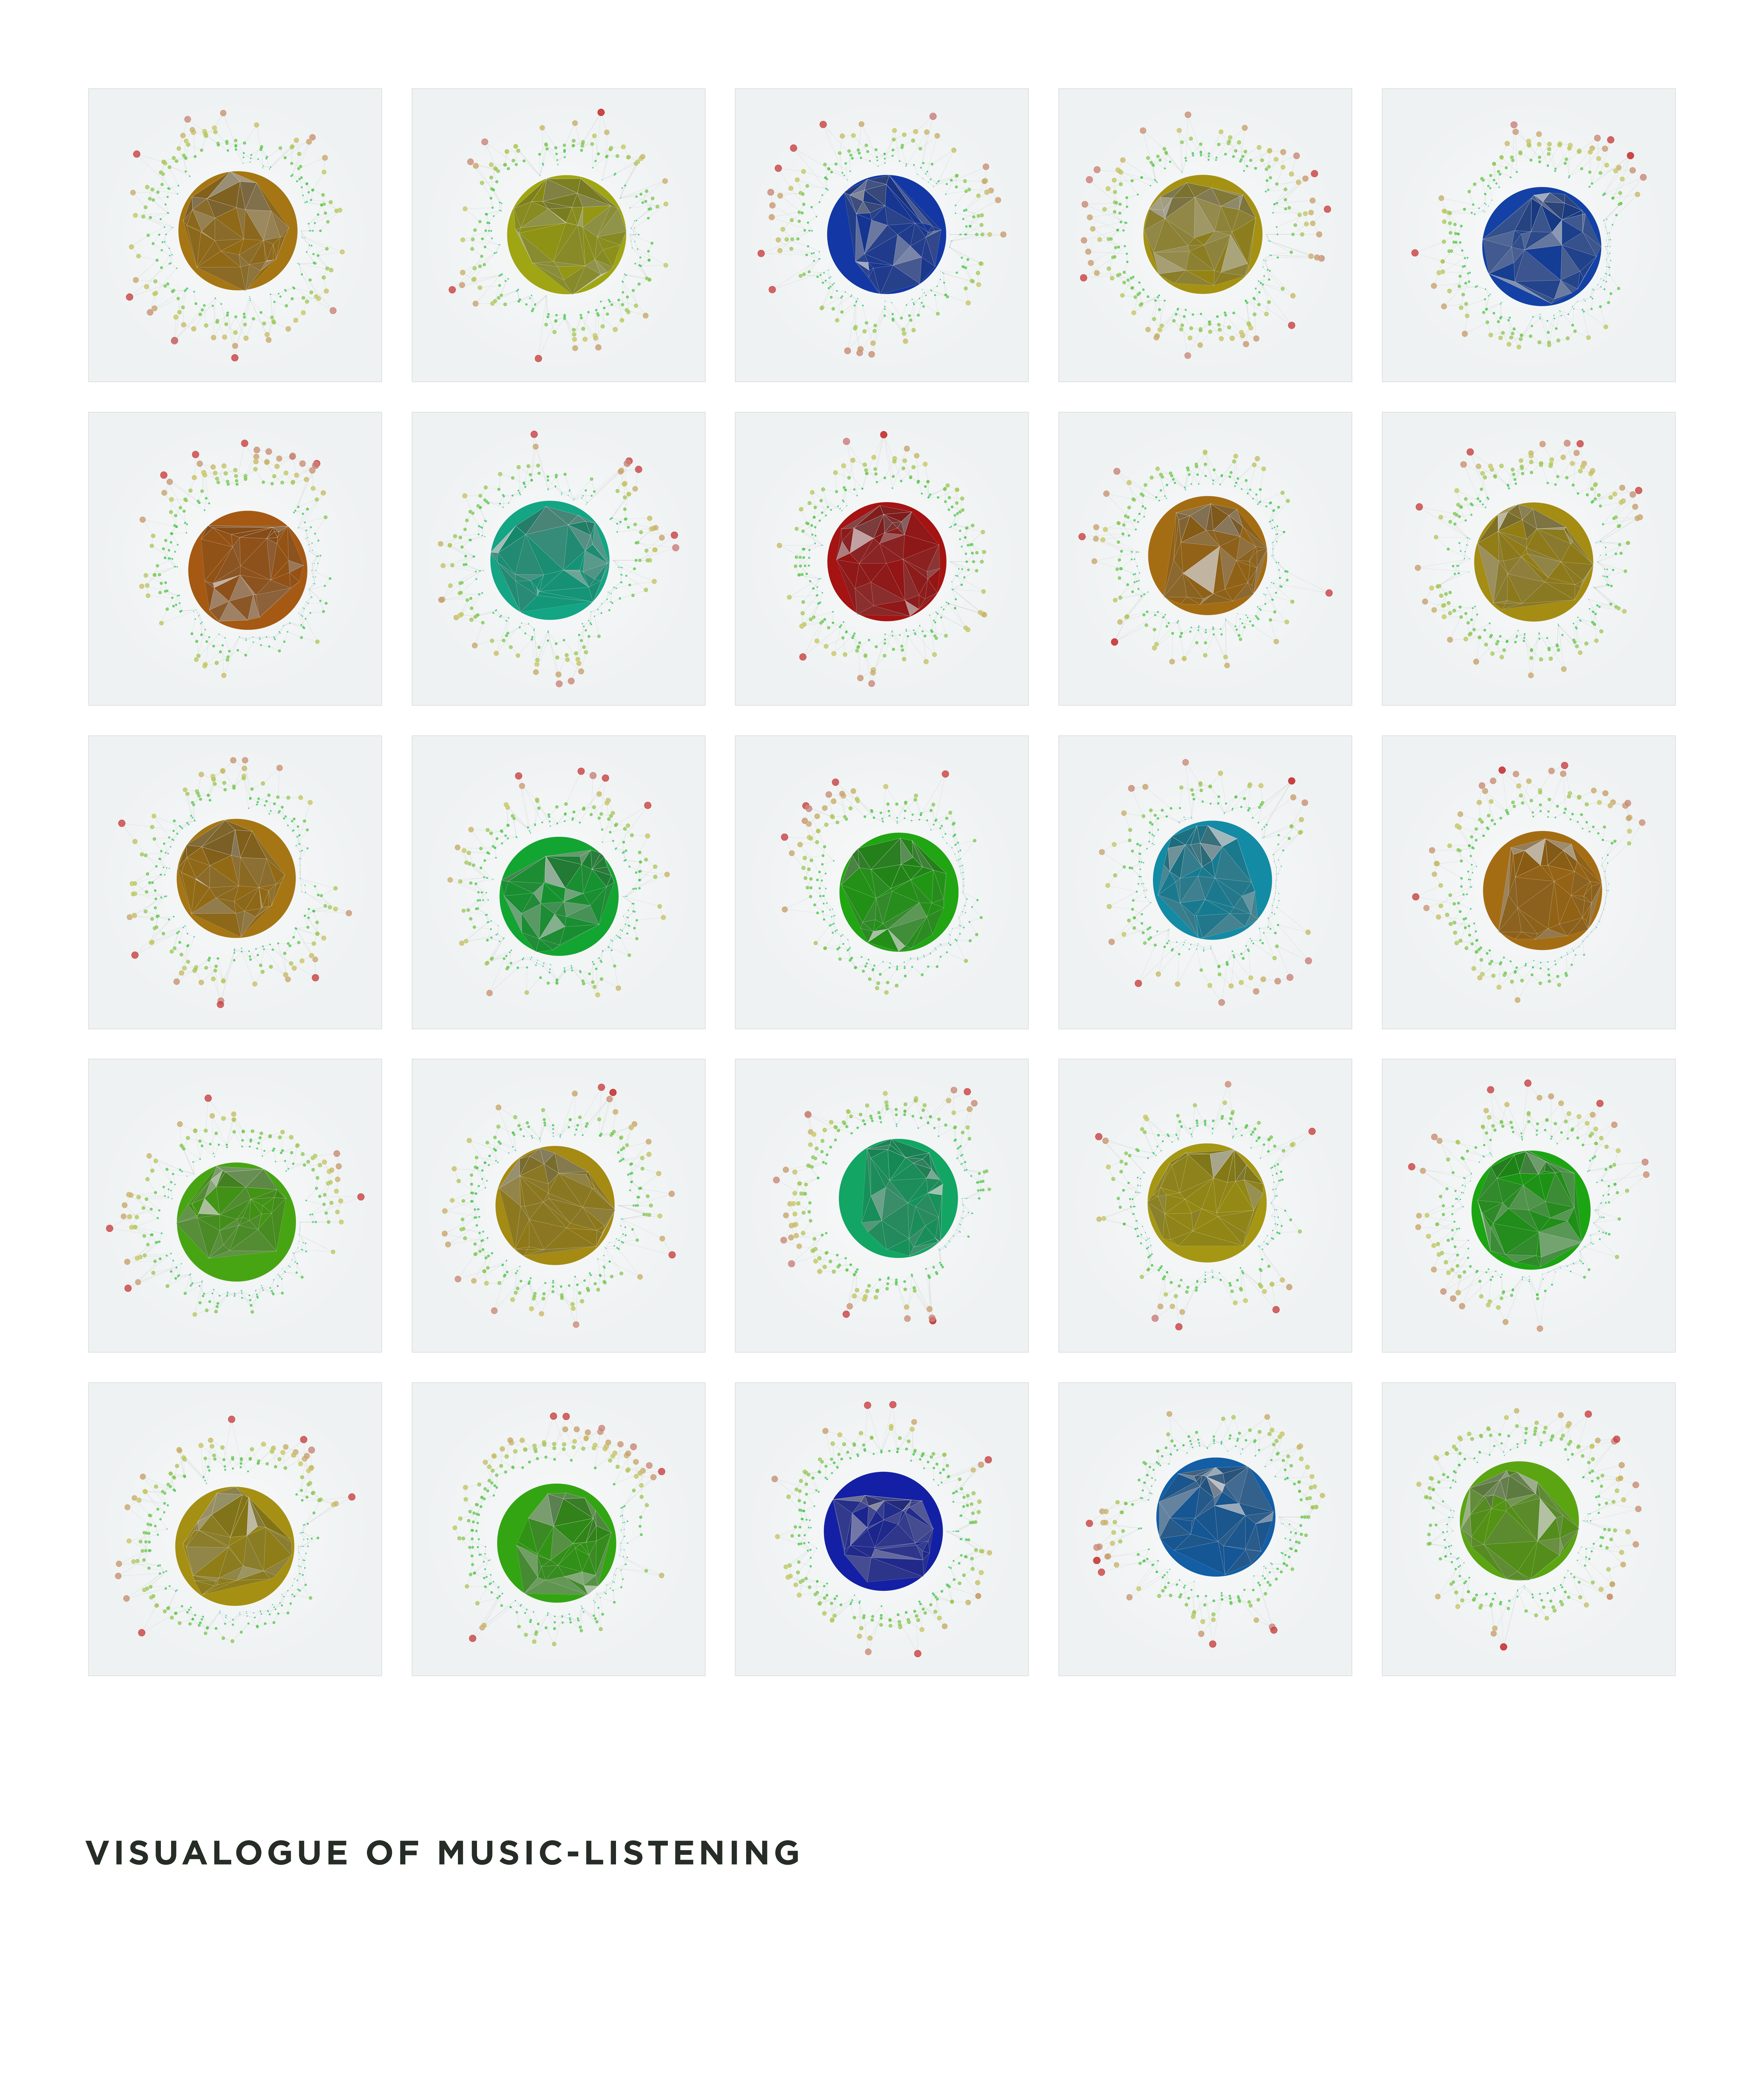
Visualogue of Music-Listening
I want to analyse 25 songs I have listened to most, and visualise the frequency bands at specific intervals to get ‘visual patterns’ for each. Then, I wish to make a poster with a 5x5 grid, with these images. It’s a whimsical attempt to see if there are any visual similarity between these, and can be used by services like spotify to provide users with collectible posters for fun, and probably will provide with some understanding of our listening-patterns.