Day nr 2 David, Simon, Samuel
Our team have decided to show Canada’s percentage of natural protected area into an infographic poster. We want to illustrate the evolution of the protected areas in Canada, and also compare it to the new objectives brought by the ecological programs, Aichi.
We saw this morning the incredible power of Nodebox for generating complex visual graphics. We had a lot of fun!
Through our research for the graphic way of representing the information, we have faced a major problem. Since the percentage of protected area is very small compared to the hole country, it is hard to show the relation of those two elements inside of a poster while keeping a good visibility on the main subject.
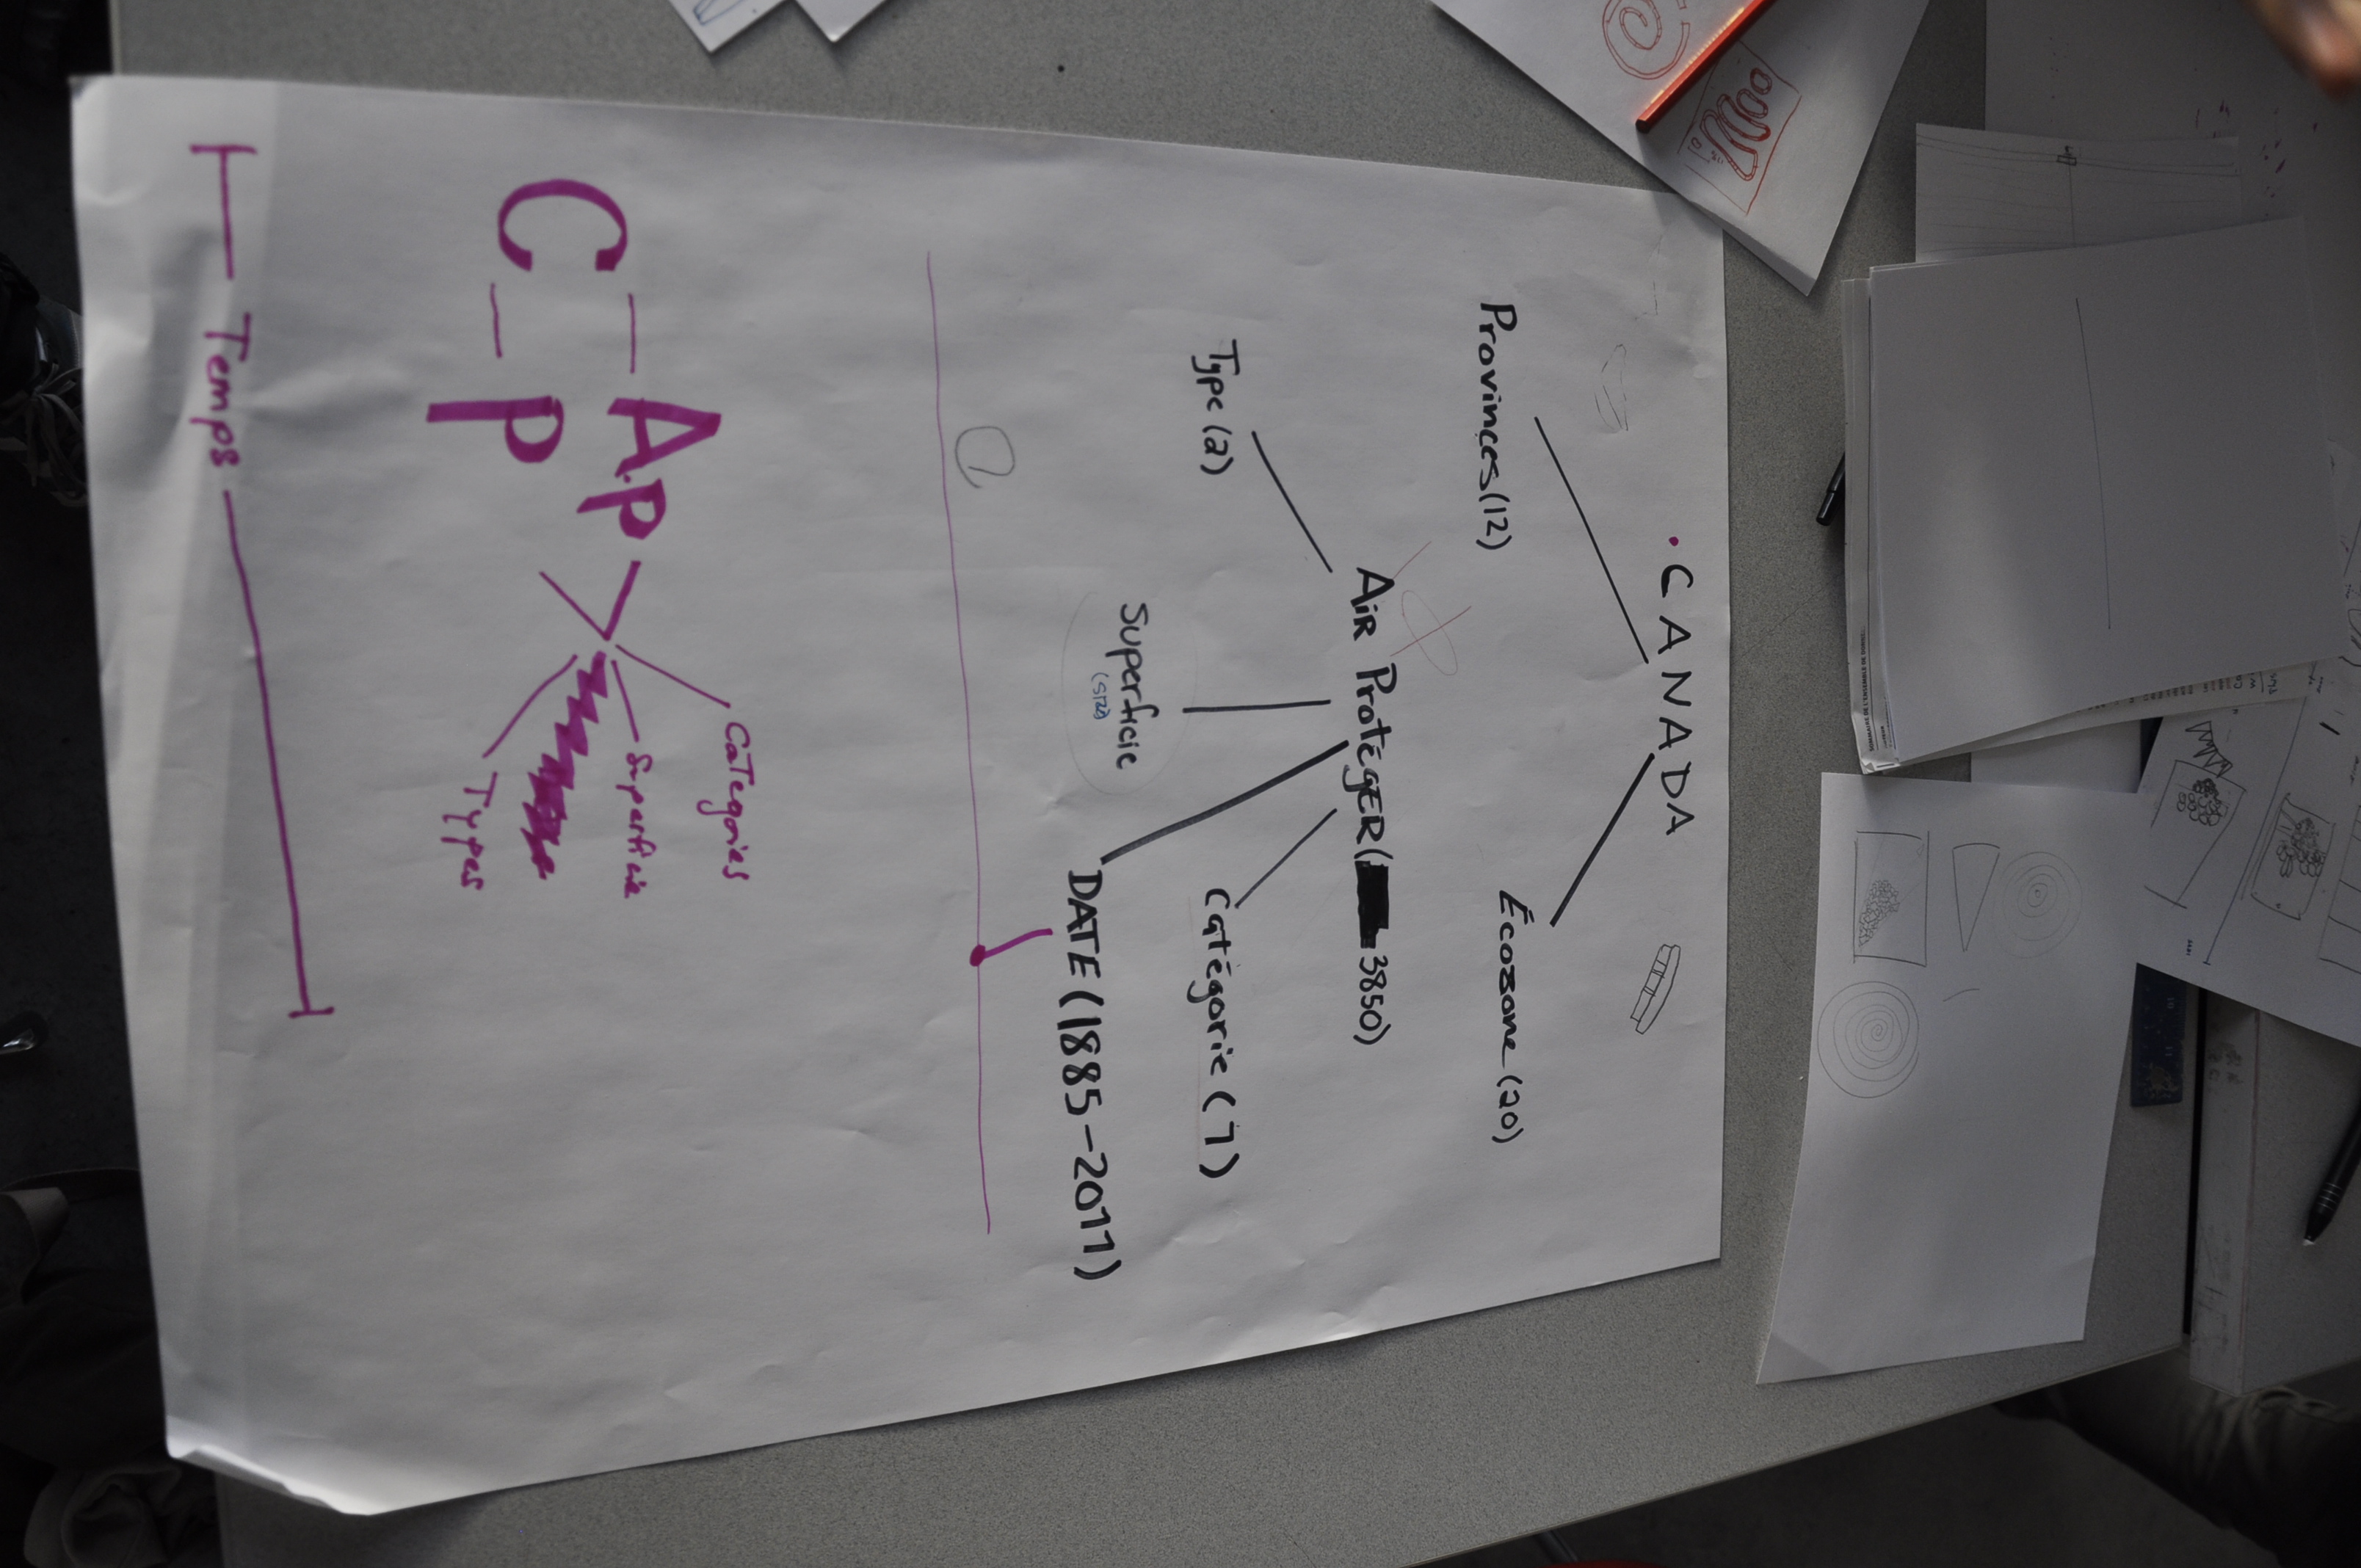
Most of the day was spent brainstorming and we now have found good solutions to most of our problems. We are impatient to continue the work tomorrow and see if our concepts works well with concrete datas.