Where are the criminals? - Step 2
Data cleaning and concept refining
Preparing for final production
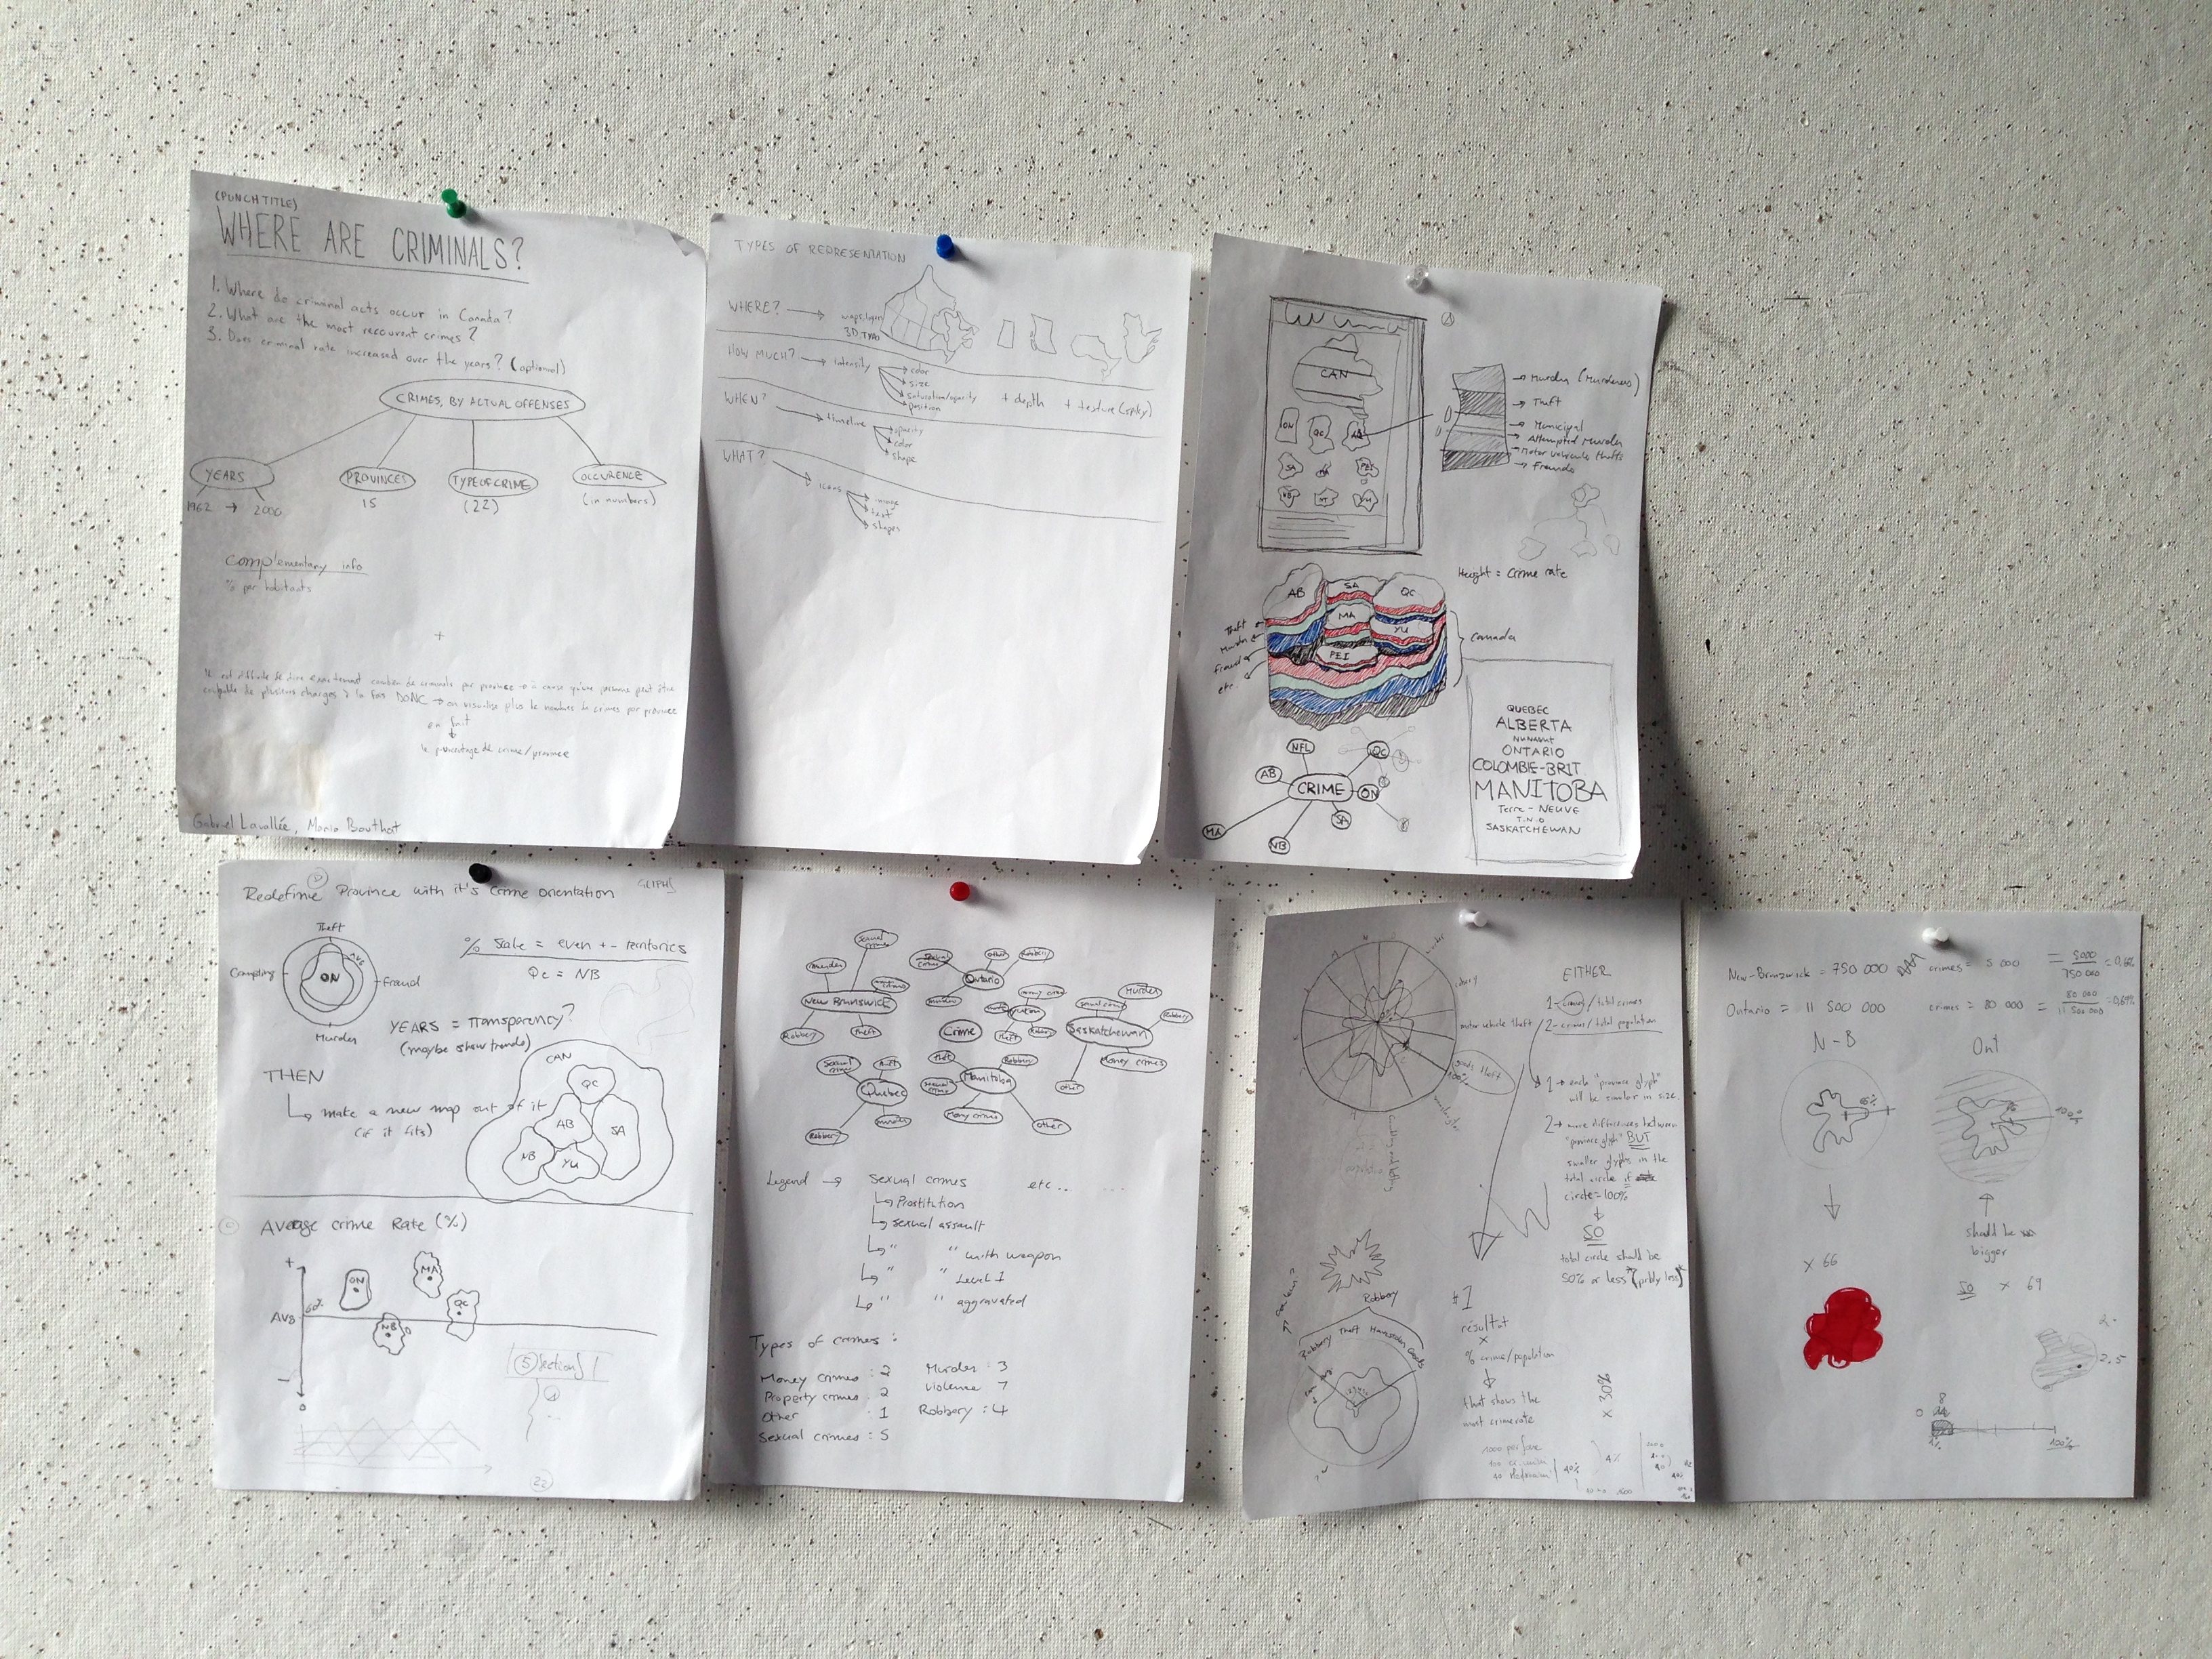
Today, we refined our concepts, trying to find out the best ways to represent time and quantity in a visual diagram. Also, we try to be as neutral as possible with data and this is why we had to adjust the correlation to size with the rate of crime in proportion to the data representation.
The way we represent the criminal act trends and quantity is by producing a visual profile of crime for each of the provinces. There are 24 crimes categorized at the moment. They will be transposed into percentages up to a total of a 100%. Each crime will have a dot representing its percentages and when all the dots will be connected, a shape will be produced.
The shapes defined by the criminal profile will be represented as territories and could be used as flags or icons for each province. If it is possible, we will remap Canada with those territories.
Tomorrow will we see if our concept remains as is or if changes will be made because of the production in NodeBox.
Mario & Gabriel