Day Tree
###Data manipulation, coffee spills, concept rethinking Hello deadline.###
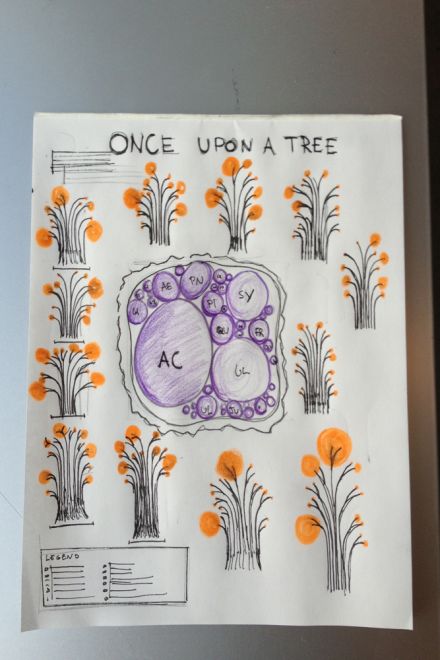
Today, we got our core concept straight. We decided to portray every neighbourhood of Montreal based on the total number of trees, the occurrence of each species and the total area covered by each species. For this purpose, every district of Montreal will be modelled according to a tree shape based on three levels: the total population, the genus and the species. The thickness of a single branch will be proportional to the absolute number of trees in the embranchment. A branchs elongation to the next node is determined by the average tree diameters comprised in that branch. Also, the leaves are described by ellipses that are proportional to the sum of the species trunk area. Leaves are attached to the endings of their respective species. To determine which neighbourhoods are greener, we will calculate the overall area covered by trees over the area of the neighbourhood. Each tree will then be attributed a tint based on its tree representation.
The center of the poster will represent the big picture of Montreals tree family. Every genus will be pictured by an ellipse proportional to the total trunk area of that genus throughout Montreal.
Globally, our poster will answer two straightforward questions: which neighbourhood is the greener and which species of tree is mostly occurring in the city of Montreal?
