Where are the criminals? - Step 3
Production of the Poster
Final production
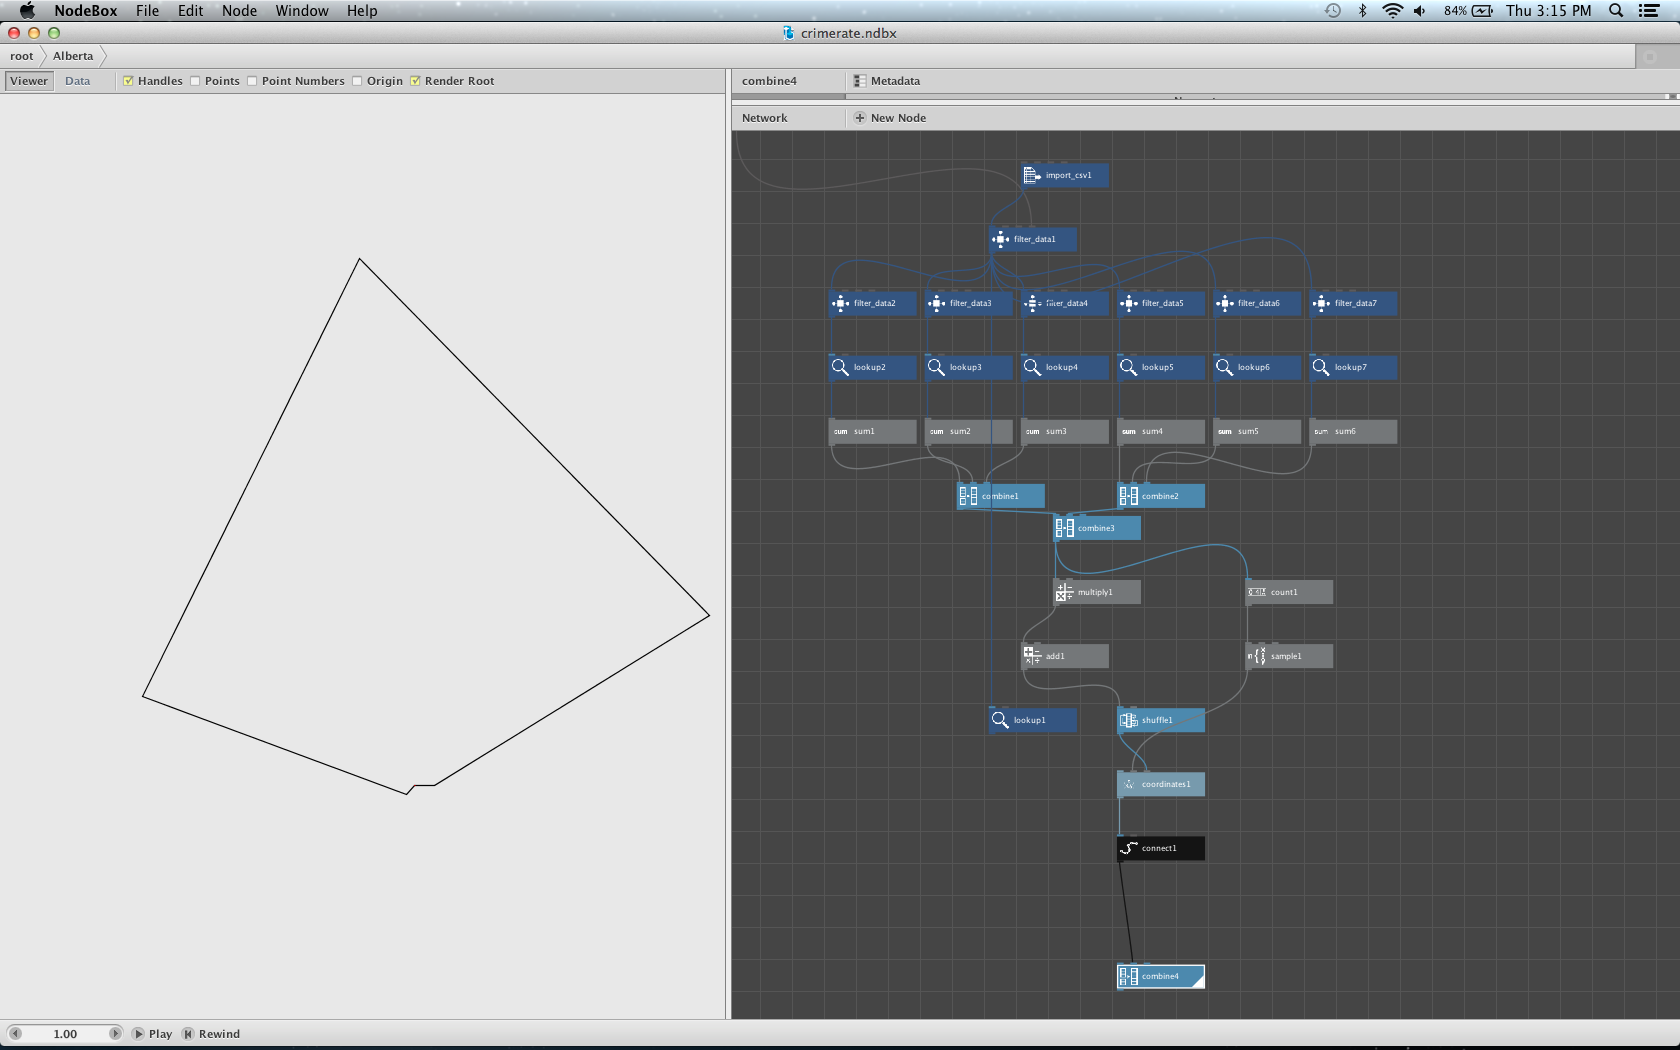
Today, when visualizing the final data into NodeBox, we realized that the output shapes were very awkward, because of spikes caused by enormous data and zeros. In this way, we had to change our data by combining the 24 categories of crimes into 6 bigger categories. This way, the visualization was much better. Also, the production in NodeBox was very simple and fast.
Another thing we noticed was that the shapes were sometimes very similar and all directed towards one direction. We then decided to eliminate the outer circle that was used as reference point. What we did instead was to use color gradient, ranging from light to dark to represent the position of the origin within the shapes.
We are currently at the last step of the production which is finalizing the poster for presentation. We hope that the results will be satisfactory.
Mario & Gabriel