Third day, Team JAJ
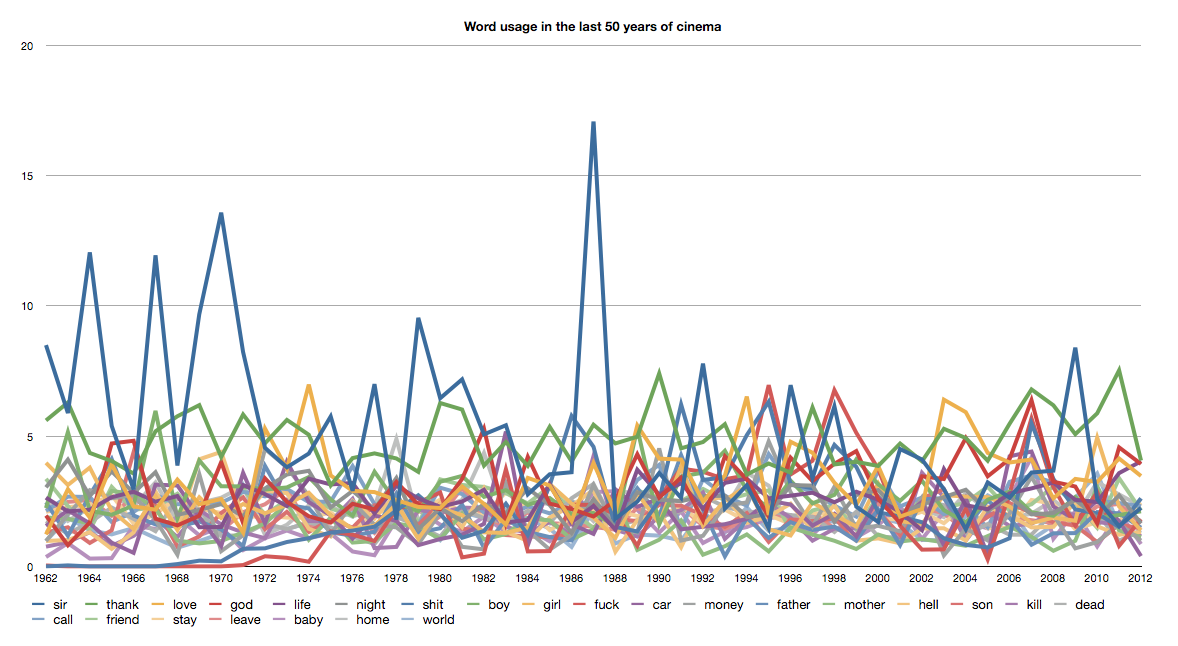
Over the last day, we gathered the data and tried to come up with good ways to visualize the complexity of it. We wanted to measure the change in usage of certain words in cinema. To get the best results, we decided to:<div><ol><li>Find the most popular movies in the last 50 years. IMDb lists the most popular movies for every year. Jonas wrote a script to crawl IMDb and find top movies with their IMDb ids (needed for later). The results can be seen in one of the pictures.</li><li>Download subtitles for every movie. As was expected, this was far from easy. Luckily, OpenSubtitles has an API and some command-line tools for it. Sadly, they block IPs after a few hundred requests, so we had to change IPs three times. Anyway, in the end we had 500 hundred subtitle files, 10 for every year. To download and process all the subtitles we used another script Jonas wrote. Sample data is attached.</li><li>Then we cleaned and merged the subtitles, and analysed it with Python patterns library.</li><li>Finally, we calculated frequencies for interesting words and converted the data to CSV.</li><li>With CSV, we were able to graph the output and see the early results. The first graph is attached.</li></ol><div>On visualisation side, we came up with an idea of sound wave. That would mean splitting every line into its own graph and generating a sound-wave-looking vibration, that corresponds with the word usage frequency throughout 50 years of cinema.</div></div>