Final Results
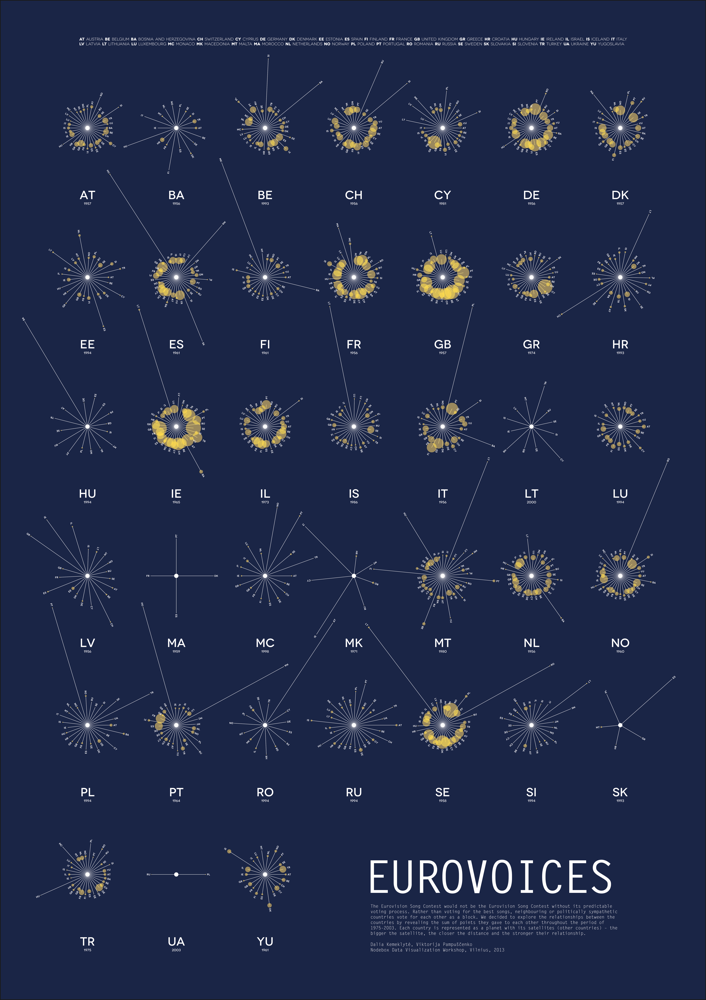
Eurovoices
The Eurovision Song Contest would not be the Eurovision Song Contest without its predictable voting process. Rather than voting for the best songs, neighbouring or politically sympathetic countries vote for each other as a block.
The group decided to explore the relationships between the countries by revealing the sum of points they gave to each other throughout the period of 1975-2003.
Each country is represented as a planet with its satellites (other countries) - the bigger the satellite, the stronger their relationship.
Data Composition
This visualization started out as an exploration showing the most creative countries. They calculated the ratio of famous artists to the total population. Artists are divided in four art categories: music, literature, visual art and theatre.
We retrieved data from Freebase but found that it was heavily skewed towards American-English artists and not representative.
Because it was so hard to measure, the project shifted towards turning the data itself into art, dedicated to Piet Mondrian.
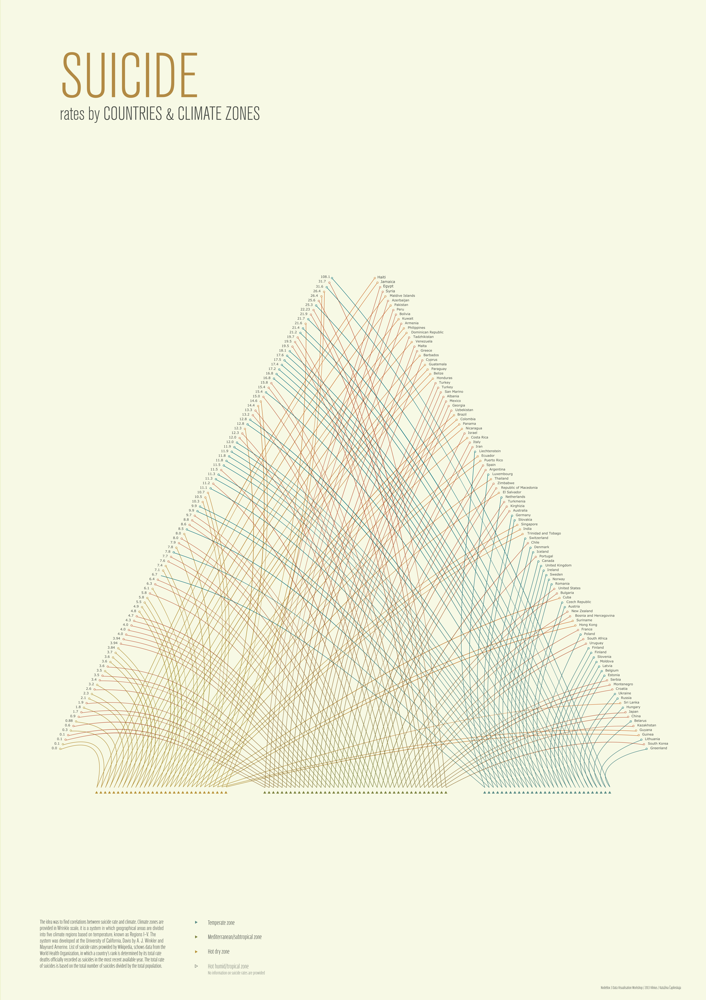
Alcohol Consumption / Suicide Statistics
This group made two separate projects.
The first project shows alcohol consumption in Europe. They made their own "data flowers" where the length represent the total consumption and the circles break down the amount of beer, wine, spirits and other drinks.
The second project examines the correlation between suicide rate and climate. Climate zones are provided in the Winkler scale, a system in which geographical areas are divided into five climate regions based on temperature. The list of suicide rates is provided by Wikipedia and shows the data from the World Health Organization in which the country's rank is determined by its total suicide rate divided by the total population.
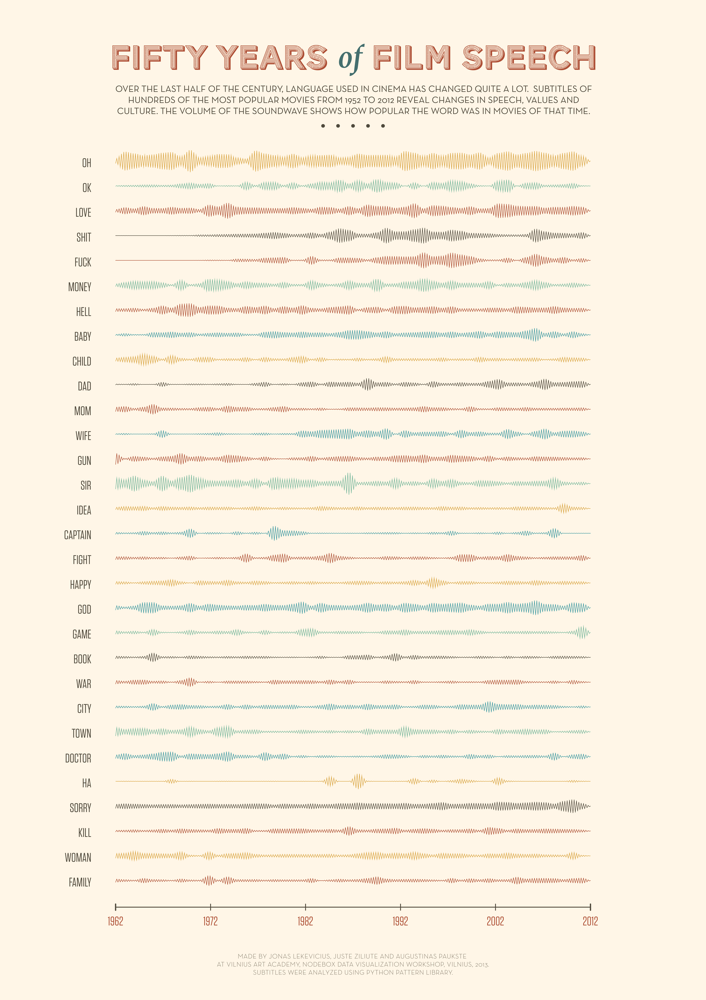
50 Years of Film Speech
Over the last half of the century, language used in cinema has changed quite a lot. Subtitles of hundreds of the most popular movies from 1952 to 2012 reveal changes in speech, values and culture.
The team analysed all the dialog from the 500 top films from 1962 to 2012 using custom Ruby scripts and the Pattern Python library.
The visualisation shows the evolution of the most interesting words as soundwaves. The volume of the soundwave shows how popular the word was in movies of that time.