Self-documenting visualisations, 16-20 March 2015.
On a morning of May of 2010, Iepe Rubingh and his crew dropped buckets of coloured paint on a busy intersection in Berlin. All of a sudden every car became a brush in a live painting showing the delicate dance of acceleration, braking and swerving across the road. A visceral, physical data visualisation emerged from that.
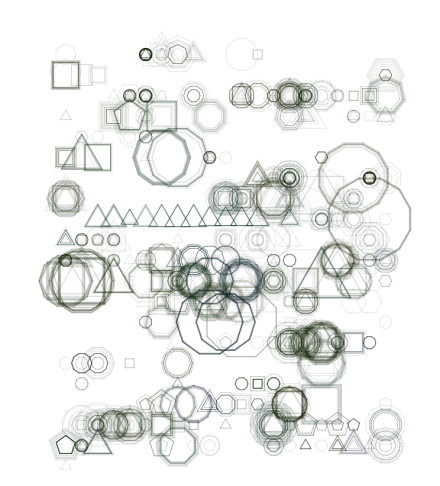
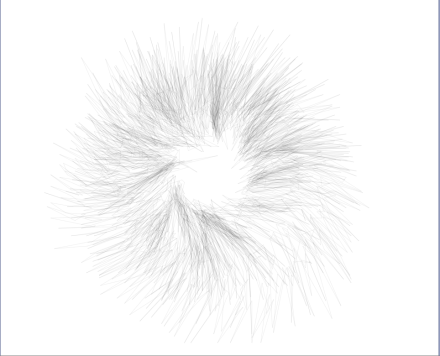
Data visualisation turns abstract information into a concrete graphical representation, thereby showing patterns, trends and outliers in the information. We see visualisations usually as clean geometric designs that present data in a formal way, but they don't have to be.
In this workshop we ask the question if we can make this transformation from data to graphics more explicit and self-documenting. A self-documenting visualisation shows the hidden patterns made explicit through a deliberate intervention, a specific registration setup, a data procedure...
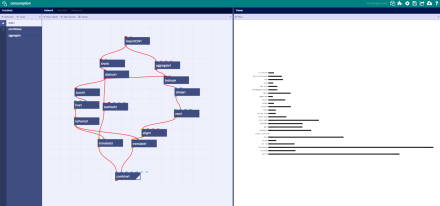
Data registration can happen through a multitude of interfaces and devices. Visualisation happens in NodeBox Live, a visual node-based tool written by EMRG and thought all over the world.