Data Visualization Workshop in Antwerp, 24-28 March 2014.
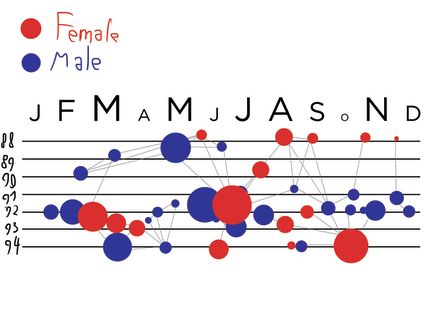
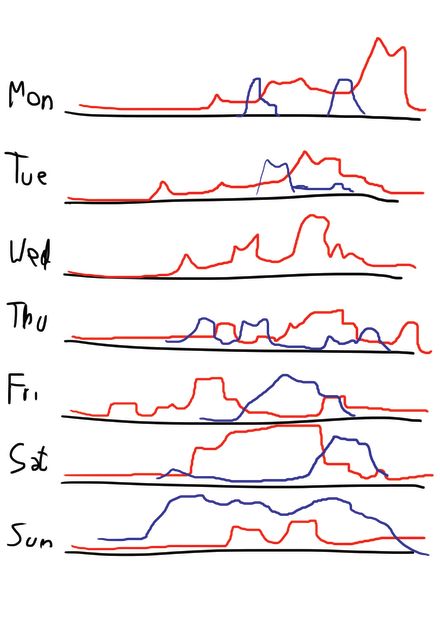
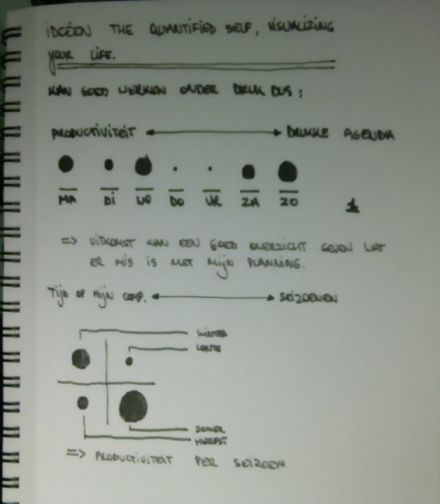
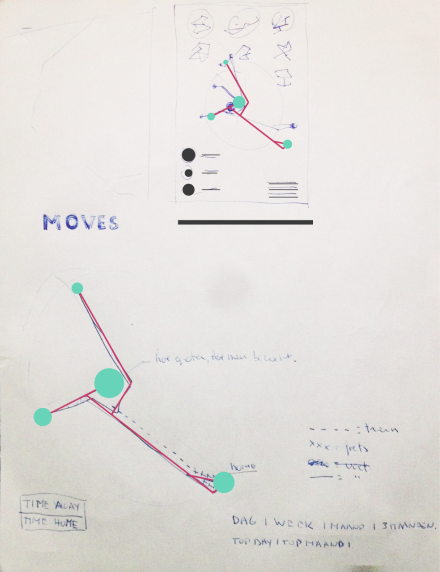
The Quantified Self: Visualizing your Life
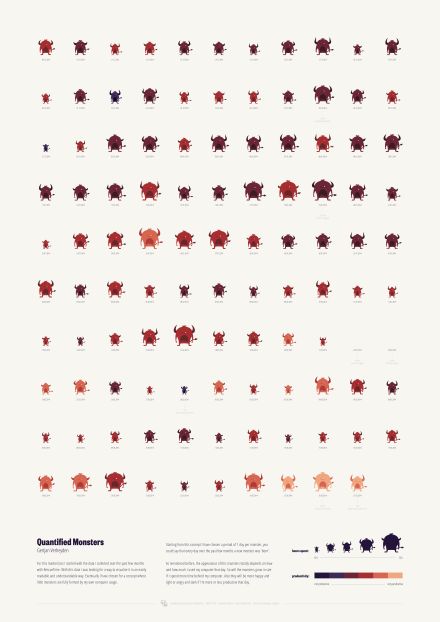
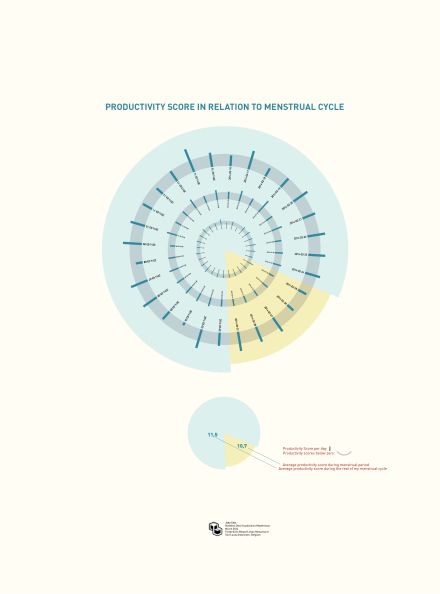
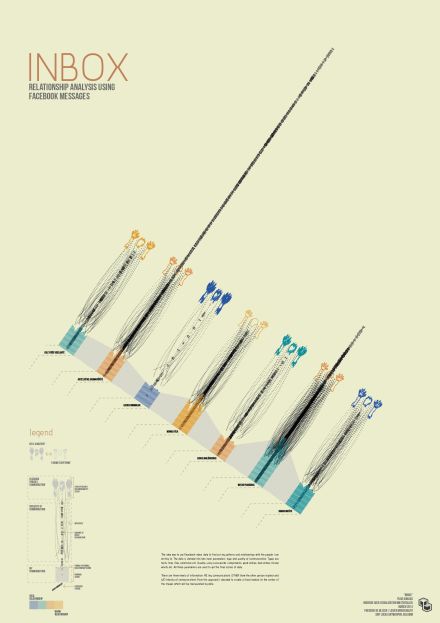
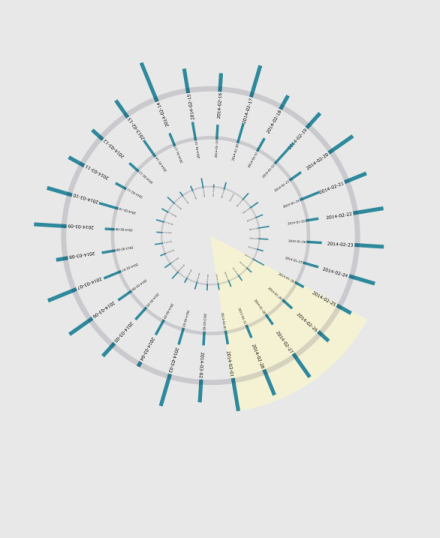
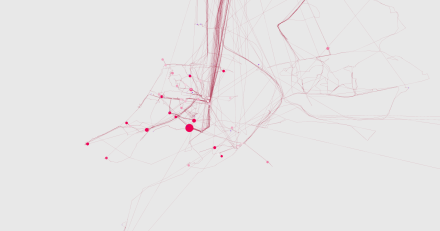
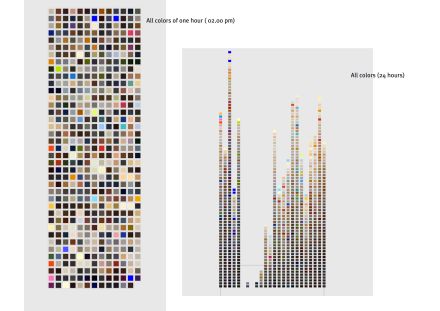
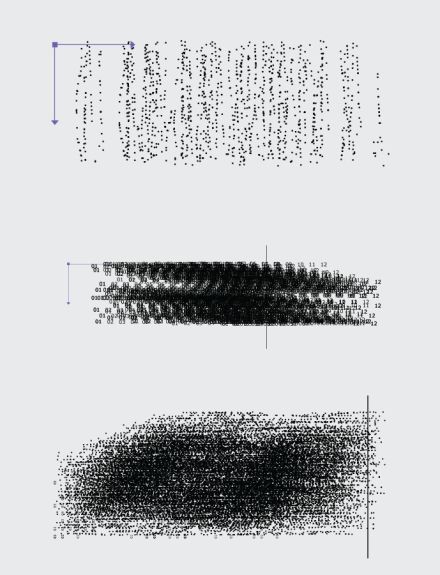
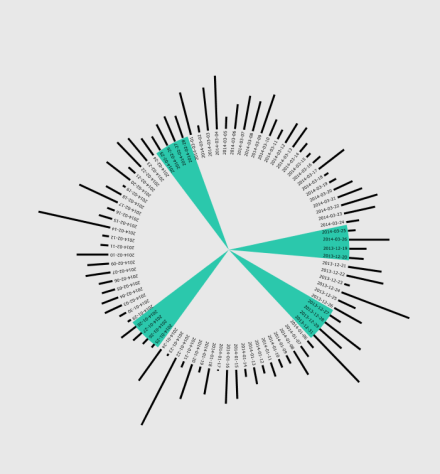
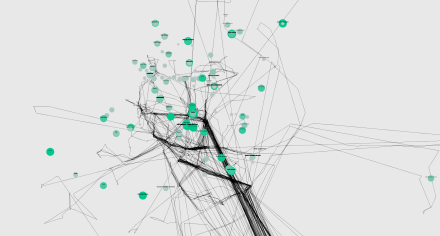
Each sms we receive, each Facebook post we like and every web search we do is captured for eternity. Its as if our existence can be reduced to an endless stream of numbers. What if we could visualize this data and discover patterns in the chaos? Can we learn something new by quantifying ourselves?
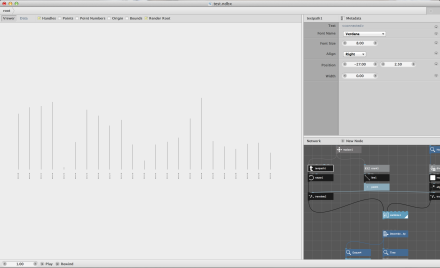
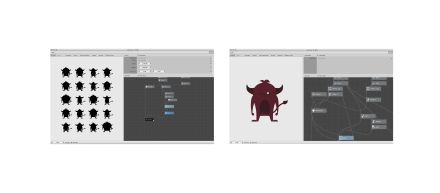
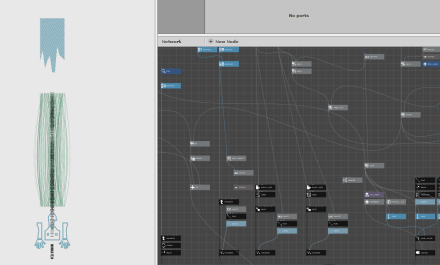
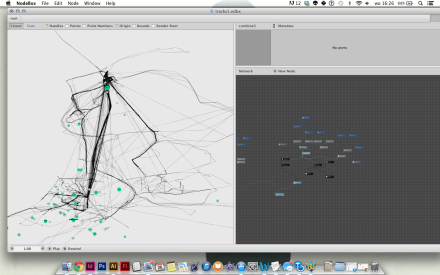
In this master class well look at ways to collect all this information and then visualize it. Well use NodeBox 3, a visual, node-based tool that does not require programming experience. Well learn how to capture, prepare, visualize and refine your data. The end result will be a poster representing you.
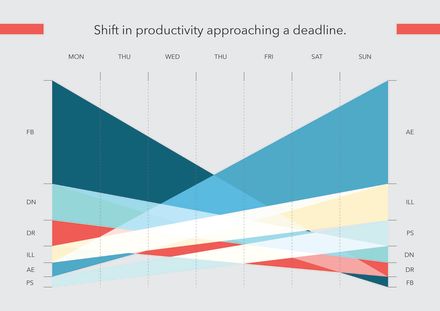
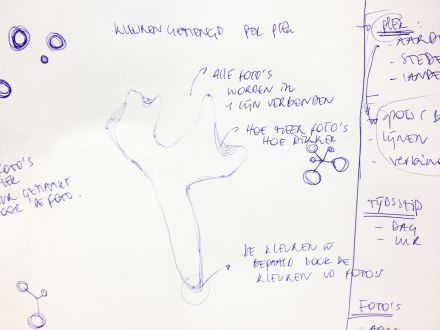
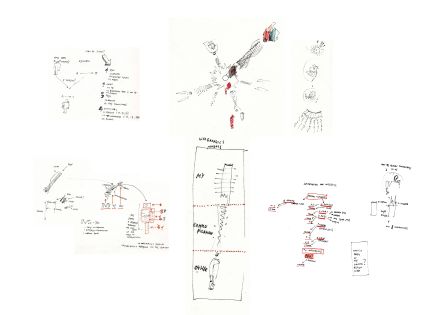
Visualizing your own data can give you new insights into your life and your habits. In addition, it is a great exercise to learn about data visualization in general.
To participate, we require you to carefully log what happens during a period of 5 months. This registration can happen using a custom-built smartphone app or on paper.