Data Visualization Workshop in Antwerp, 4-8 February 2013.
As more and more data is being generated all around us, generative art, physical computing and data visualization are becoming increasingly relevant. Learning to work with hardware inputs such as the Kinect or visualizing streams from Twitter appears appealing, but the possibilities for creating them seem out of reach for all but the most technical students that know how to write code.
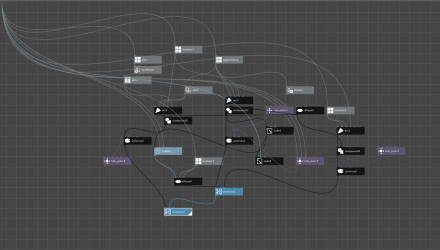
No longer! NodeBox 3 makes it easy and even fun to visualize external inputs. Using a node-based user interface you get fast access to the capabilities of physical devices and external sources like Twitter or live news feeds.
In this master class you'll learn how to acquire data from external streams and visualize it in a relevant way. You'll learn the value of a good data visualization and how to choose an appropriate representation of your data. You can pick your own data or work with data we provide. You'll create a movie or interactive installation that can get data from external inputs.
Learning this program also opens the road for learning more advanced software such as Processing, Quartz Composer or VVVV.